Fig. 3
Download original image
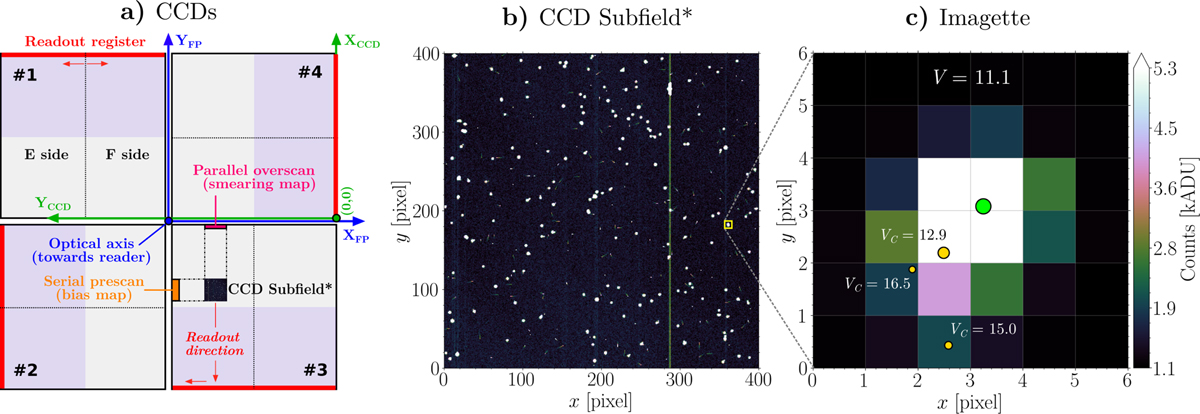
Schematic overview of how PlatoSim generates a CCD image in the FPA. (a) Illustrative overview of the N-CAM FPA with the 4 CCDs. The blue axes indicate the focal plane with the central blue dot (in the middle of the 4 CCDs) represents the optical axis ZFP pointing in the positive direction towards the reader. The green axes illustrate the origin for nCCD = 4 as a reference and the readout register of each CCD is highlighted with a red bar. Each CCD is divided into an F and E side (with independent CCD and FEE gain appliances) with anti-parallel serial readout directions. For the F-CAM the location of the metallic shields of frame-transfer CCDs are highlighted as purple shaded rectangles. (b) Simulated 400 × 400 pixel subfield of the LOP south. The subfield location on nCCD = 3 is displayed in panel a together with the corresponding parallel overscan and serial prescan region which is used by PlatoSim to reconstruct a proper smearing and bias map, respectively. (c) A so-called imagette showing a zoom-in on a target star from panel b. Indicated by the subpixel barycentres, the PIC target (green dot) has three significant fainter stellar contaminants (yellow dots scaled in size to the target star magnitude).
Current usage metrics show cumulative count of Article Views (full-text article views including HTML views, PDF and ePub downloads, according to the available data) and Abstracts Views on Vision4Press platform.
Data correspond to usage on the plateform after 2015. The current usage metrics is available 48-96 hours after online publication and is updated daily on week days.
Initial download of the metrics may take a while.