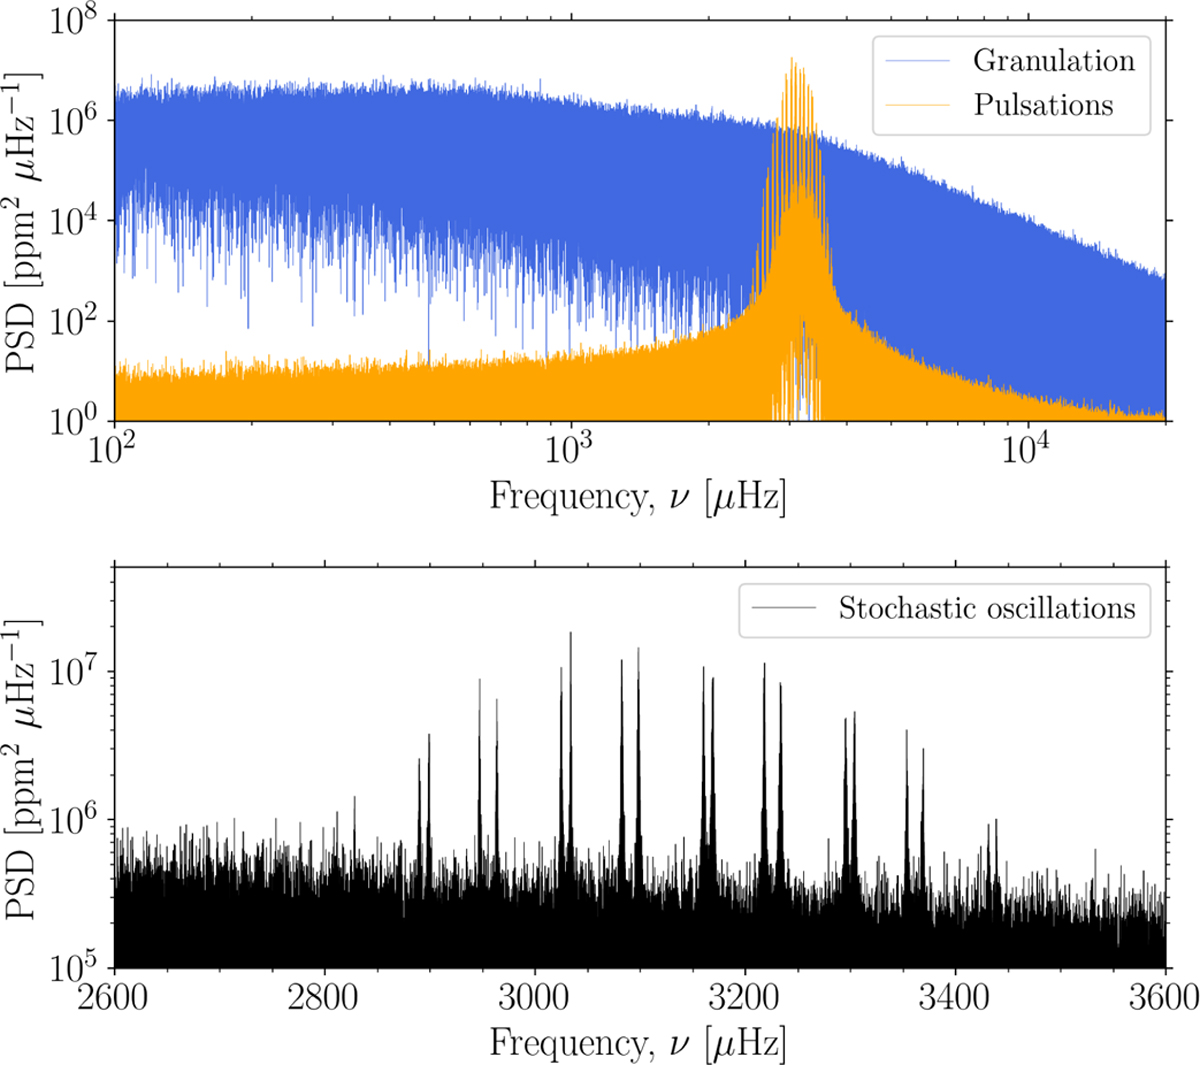
Fig. C.1
Download original image
Power spectral density (PSD) plots of a 2 уr simulated light curve due to convection-driven variability. Top: Components of the simulated granulation (blue) and stochastic oscillations (orange). Bottom: Zoom-in on the granulation and pulsation model clearly showing the recognisable envelope of frequency peaks (used to estimate νmax) and the small (δν) and large (∆ν) frequency separations.
Current usage metrics show cumulative count of Article Views (full-text article views including HTML views, PDF and ePub downloads, according to the available data) and Abstracts Views on Vision4Press platform.
Data correspond to usage on the plateform after 2015. The current usage metrics is available 48-96 hours after online publication and is updated daily on week days.
Initial download of the metrics may take a while.