Fig. 2
Download original image
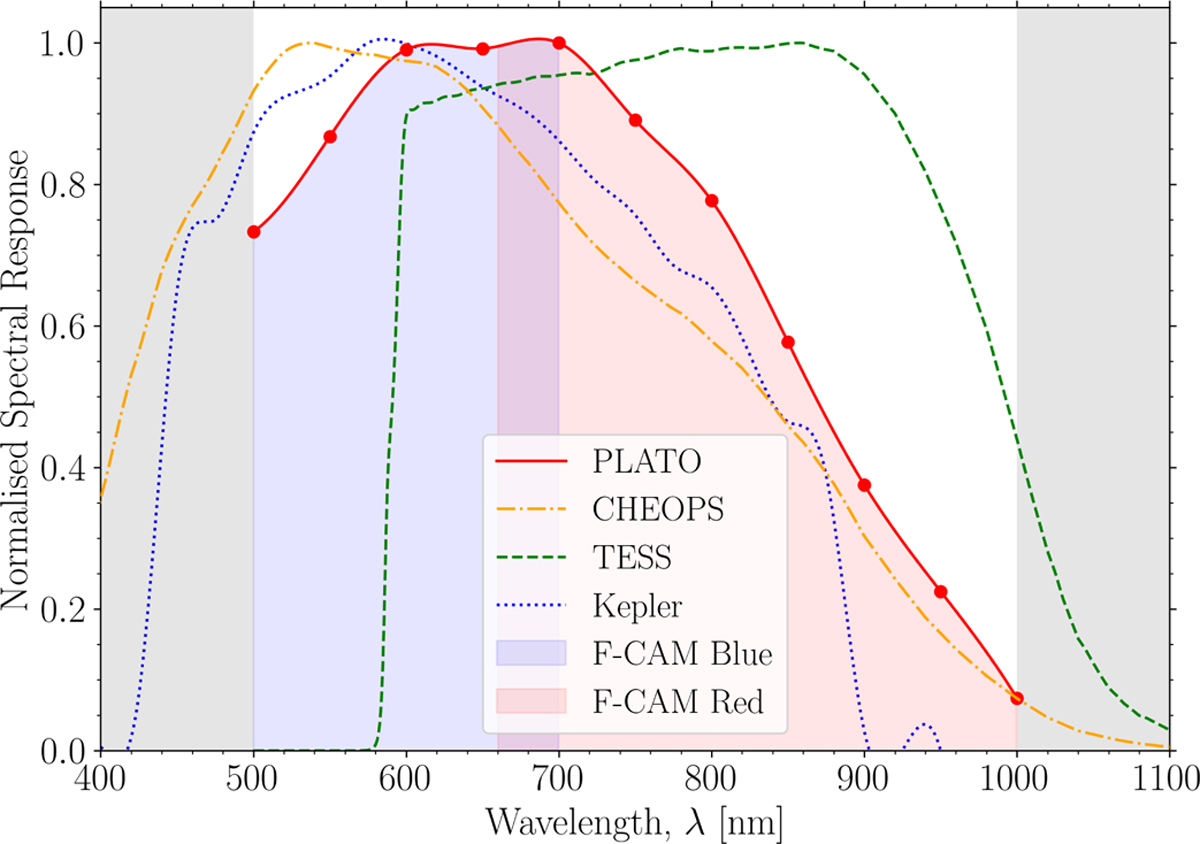
Preliminary normalised N-CAM spectral response curve at beginning of life (BOL; with the red dots representing the mission requirements) compared to those similar planet hunting missions such as CHEOPS (orange dotted-dashed line), TESS (green dashed line) and Kepler (blue dotted line). Each response curve is computed with cubic spline interpolation for illustrative purposes. The grey shaded areas are cut-off wavelengths which are dominated by optical transmission in the blue (left) and by the CCD anti-reflection coating in the red (right). The blue and red shaded regions illustrate the blue and red transmission regions of the two F-CAMs, respectively. Data courtesy: ESA and NASA.
Current usage metrics show cumulative count of Article Views (full-text article views including HTML views, PDF and ePub downloads, according to the available data) and Abstracts Views on Vision4Press platform.
Data correspond to usage on the plateform after 2015. The current usage metrics is available 48-96 hours after online publication and is updated daily on week days.
Initial download of the metrics may take a while.