Fig. 18
Download original image
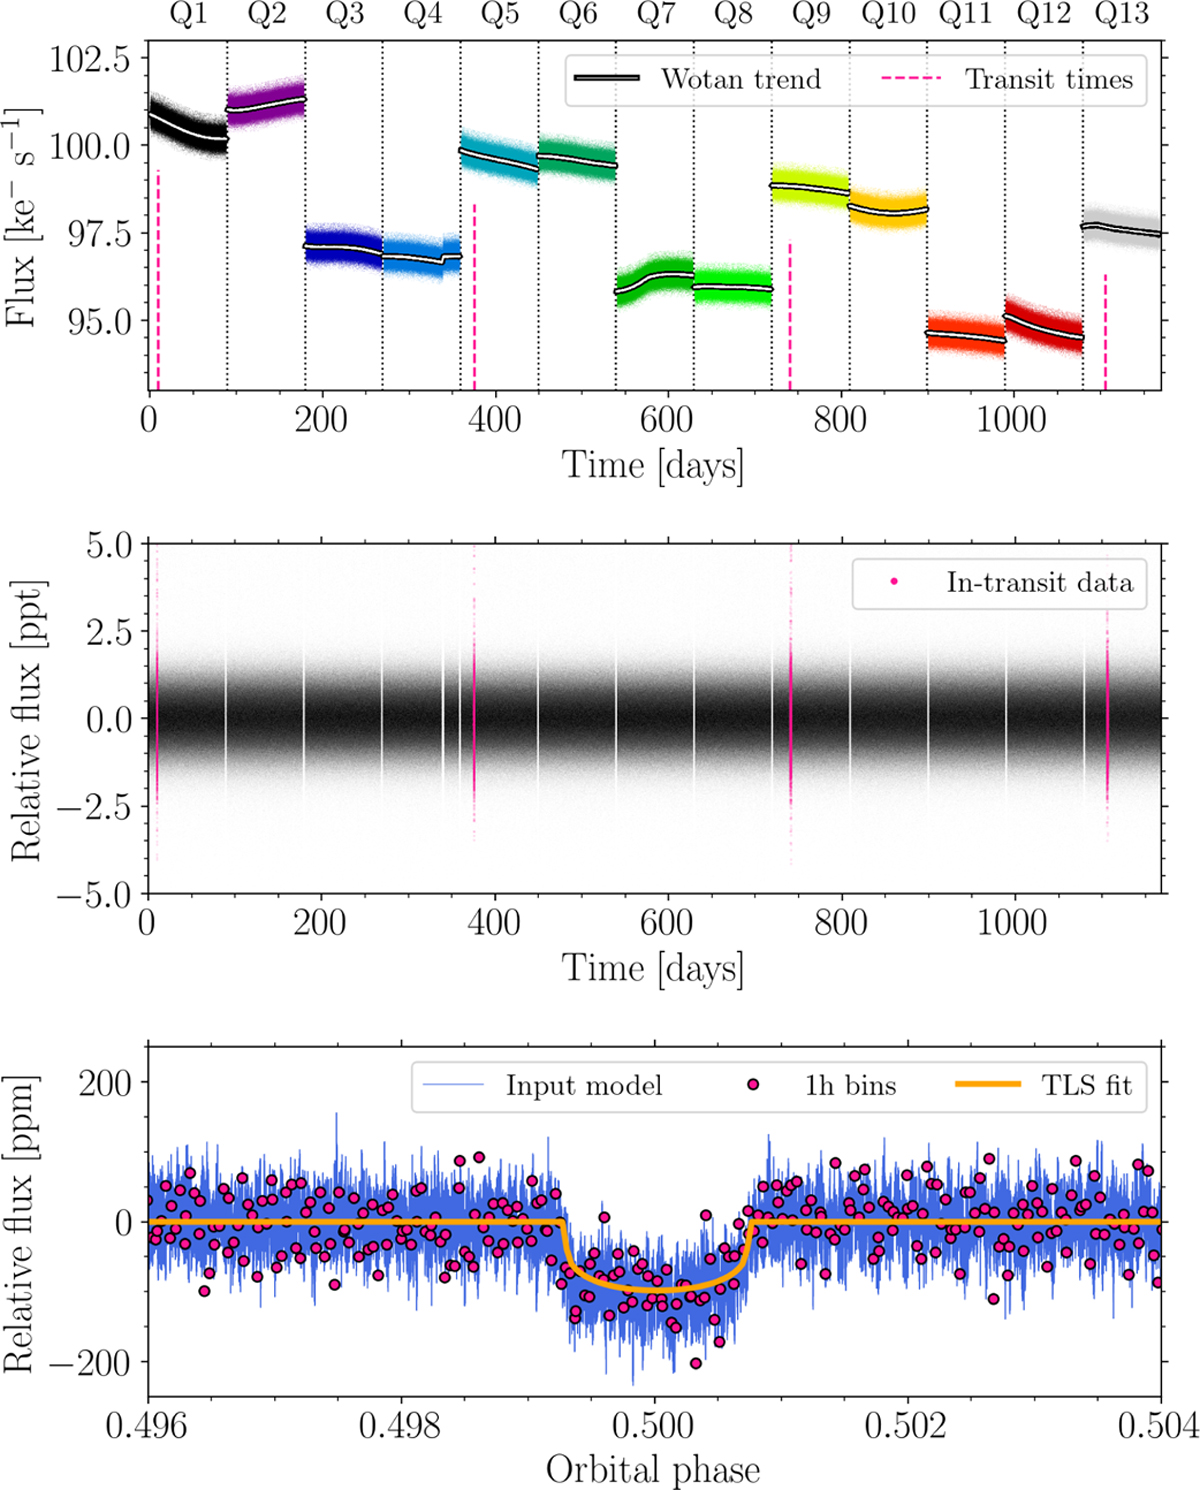
Results of the Hare and Hound (injection and retrieval) exercise of an Earth-sized planet transiting a V = 10 Sun-like star. With an orbital period of 365.25 d the planet transits 4 times in the 3.3 yr simulated light curve. Top: Light curves observed with a single camera (coloured per quarter) and the corresponding Wōtan trend (white/black lines). Middle: detrended light of all 24 camera observations (black dots) with in-transit data highlighted (dots). Bottom: Phase folded light curve on the best fit period from TLS. For clarity a 1 h binned representation of the light curve is shown (pink circles), together with the injected variability (blue line), and a best fit transit model (orange line).
Current usage metrics show cumulative count of Article Views (full-text article views including HTML views, PDF and ePub downloads, according to the available data) and Abstracts Views on Vision4Press platform.
Data correspond to usage on the plateform after 2015. The current usage metrics is available 48-96 hours after online publication and is updated daily on week days.
Initial download of the metrics may take a while.