Fig. 17
Download original image
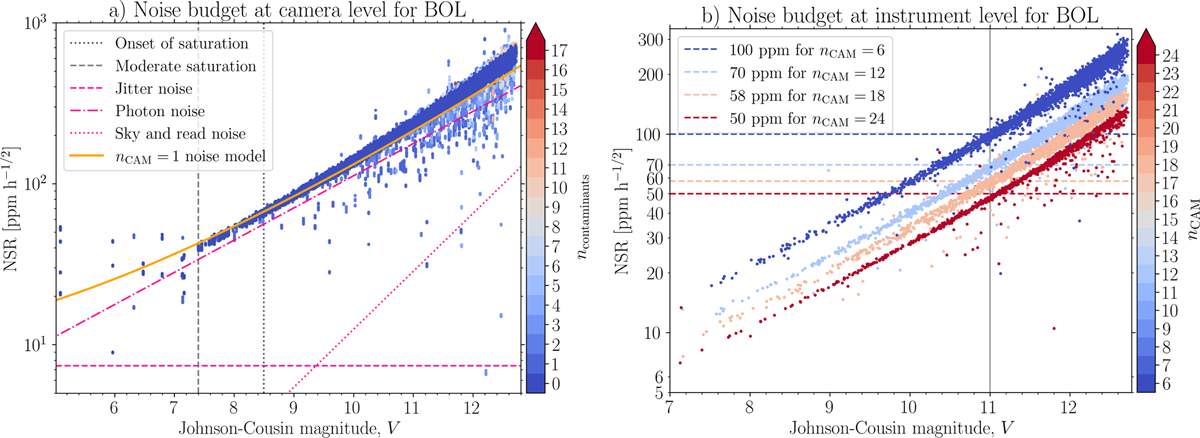
NSR(V) simulation study at BOL as required by the mission. (a) Noise budget at the camera level with each data point coloured after the number of stellar contaminants contained within 3 pixel and ∆V < 5 of the target star. The model prediction of the noise (orange solid curve) consists of three photometric noise components: jitter noise (pink dashed line calculated using an averaged (yaw, pitch, and roll) jitter time series rms amplitude value of 0.037 arcsec) dominating in the bright regime, readout and sky background noise (pink dotted line using a sky background value of around 60 e− pixel−1 s−1) dominating in the faint regime, and photon noise (pink dashed-dotted line) dominated between the two aforementioned regimes. Also the onset of saturation is indicated (grey dotted line) together with the onset of moderate saturation (grey dotted line) here defined as where an extended mask expanding beyond the dimensions of an imagette is needed to capture total stellar flux due to blooming. (b) Noise budget at the instrument level with each data point representing a multi-camera observation colour by the number of N-CAM observations used in the NSR calculation. The mission requirement of the photometry for V < 11 is shown for an observability of nCAM ∈ {6,12,18,24} (horizontal dashed lines coloured after nCAM).
Current usage metrics show cumulative count of Article Views (full-text article views including HTML views, PDF and ePub downloads, according to the available data) and Abstracts Views on Vision4Press platform.
Data correspond to usage on the plateform after 2015. The current usage metrics is available 48-96 hours after online publication and is updated daily on week days.
Initial download of the metrics may take a while.