Fig. 12
Download original image
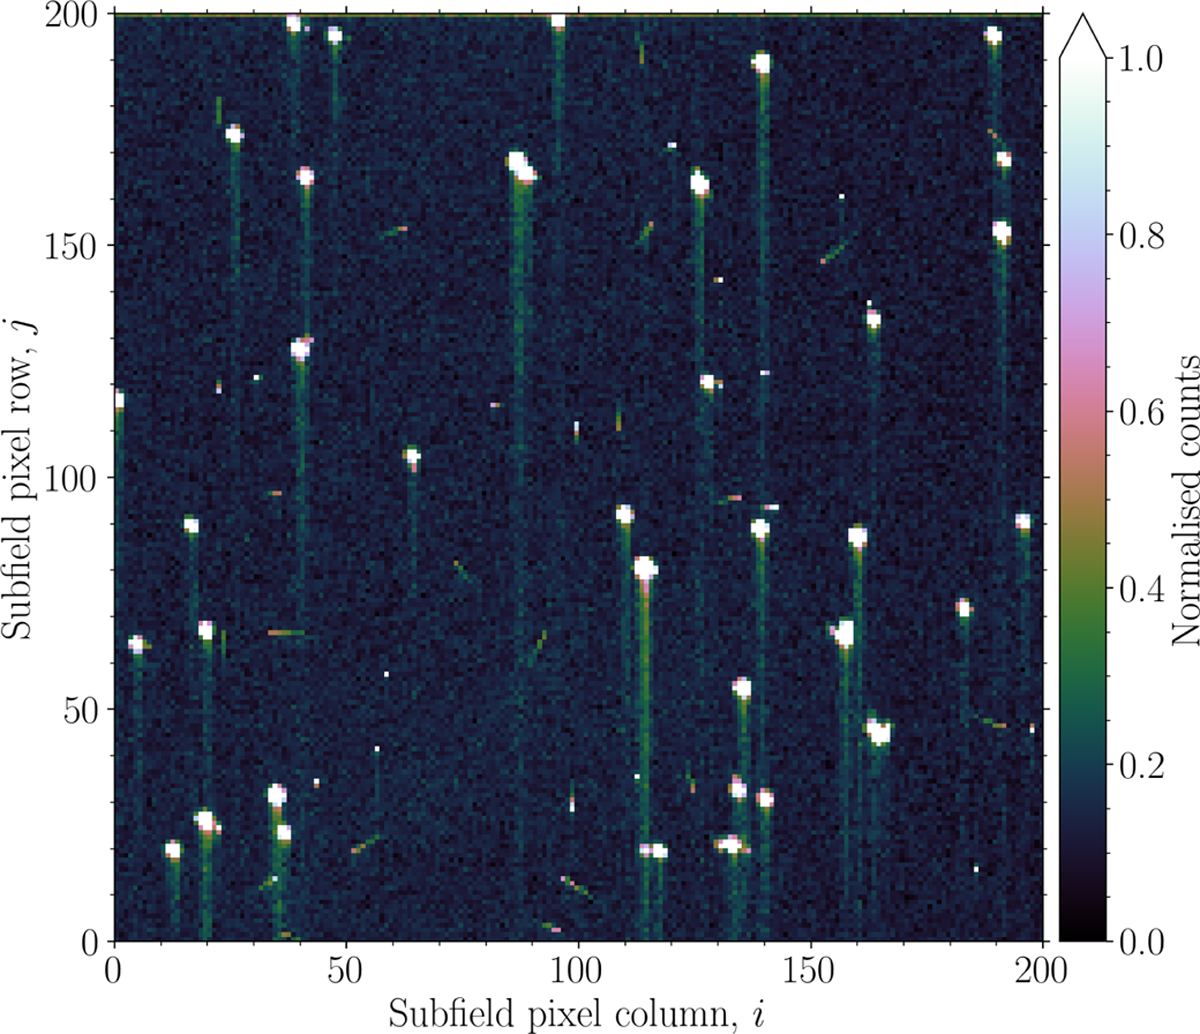
Illustration of the effect of CTI at post mission EOL (i.e. 6.5 yr after commissioning) using the Short model. The plot shows a centrally placed 200 × 200 pixel CCD subfields of PIC stars from the LOP south including cosmic rays simulated using a hit rate of 10 events s−1 cm−1. The images has been clipped by a 2σ cut and then normalised for illustrative purposes. The readout register is located towards the bottom of the image.
Current usage metrics show cumulative count of Article Views (full-text article views including HTML views, PDF and ePub downloads, according to the available data) and Abstracts Views on Vision4Press platform.
Data correspond to usage on the plateform after 2015. The current usage metrics is available 48-96 hours after online publication and is updated daily on week days.
Initial download of the metrics may take a while.