Fig. 10
Download original image
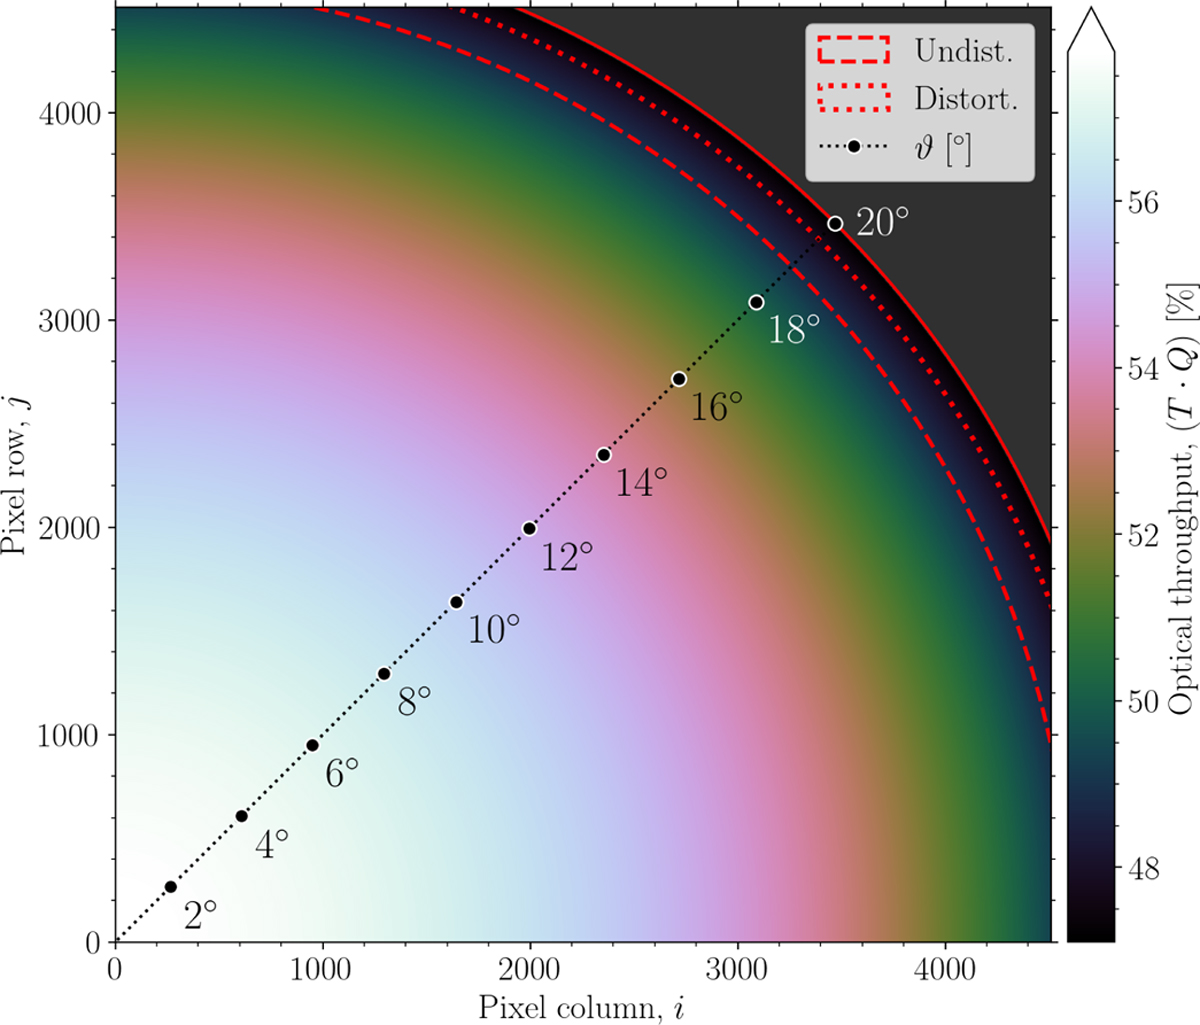
Illustration of the total throughput map for one full frame CCD. The dotted diagonal line shows the distance from the optical axis in degrees (ϑ) and the red dashed lines show the angular position of the stray light mask. We note that the FOV in the focal plane physically extents beyond ϑmax (to ~19.6° indicated by the red dotted line) due to the effect of optical distortion cf. Sect. 6.5 and is followed by an exponential intensity decay of vignetting (modelled out to 20° shown by the red solid line).
Current usage metrics show cumulative count of Article Views (full-text article views including HTML views, PDF and ePub downloads, according to the available data) and Abstracts Views on Vision4Press platform.
Data correspond to usage on the plateform after 2015. The current usage metrics is available 48-96 hours after online publication and is updated daily on week days.
Initial download of the metrics may take a while.