Open Access
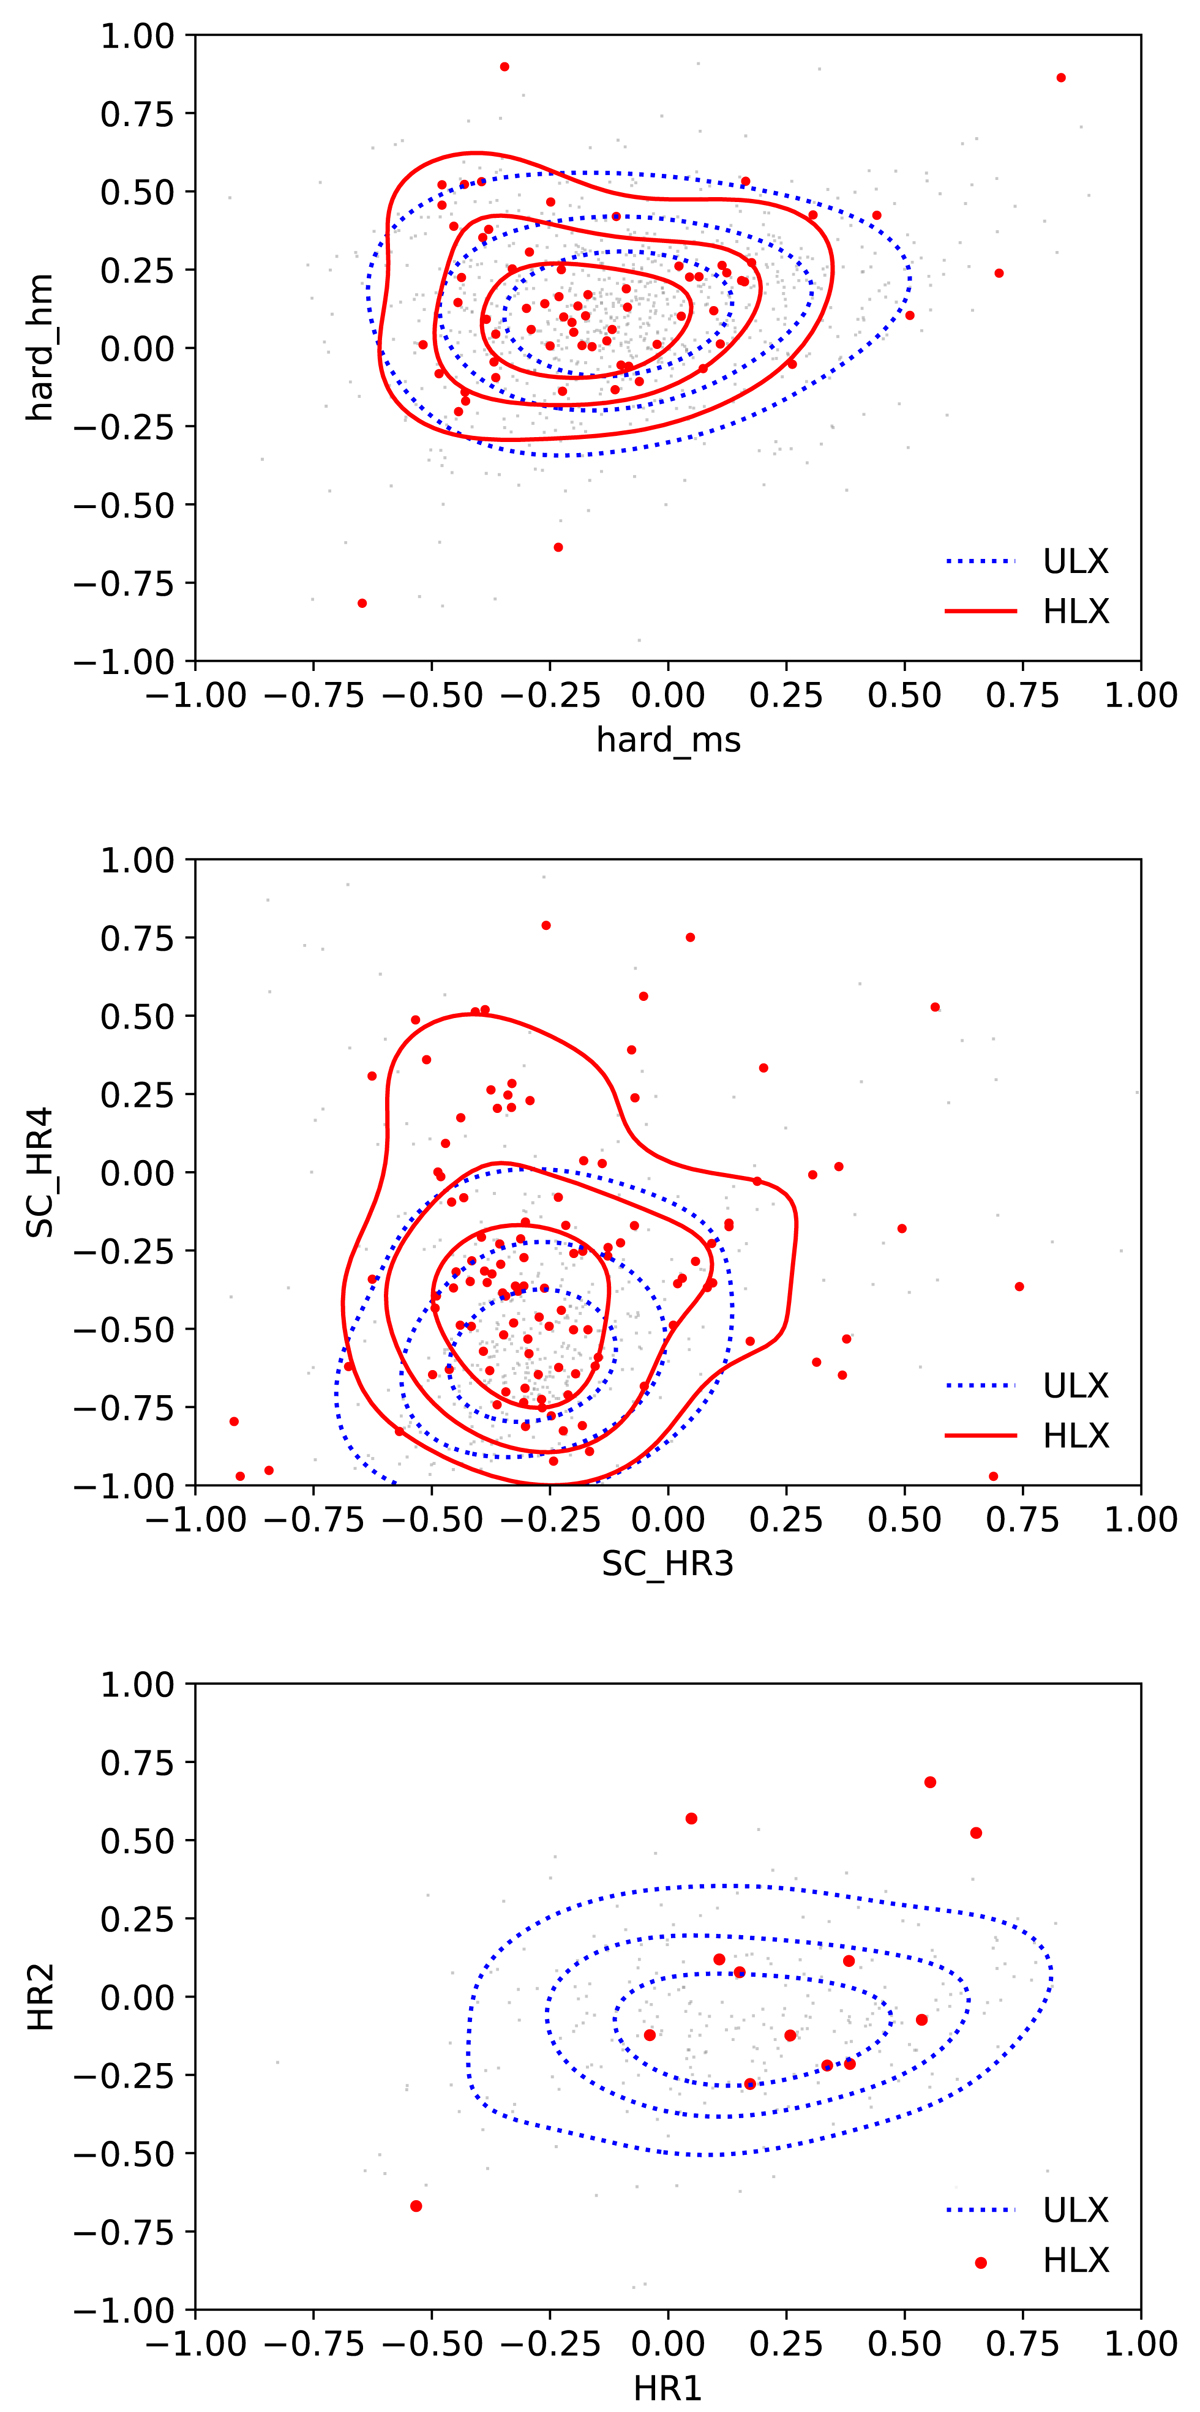
Fig. 17.
Download original image
Hardness–hardness diagrams of ULX and HLX candidates from Chandra (top), XMM-Newton (middle) and Swift (bottom). Grey and red dots correspond to ULXs and HLXs, respectively. Contours at 25th, 50th and 75th percentiles are shown to ease visualisation.
Current usage metrics show cumulative count of Article Views (full-text article views including HTML views, PDF and ePub downloads, according to the available data) and Abstracts Views on Vision4Press platform.
Data correspond to usage on the plateform after 2015. The current usage metrics is available 48-96 hours after online publication and is updated daily on week days.
Initial download of the metrics may take a while.