Fig. 14.
Download original image
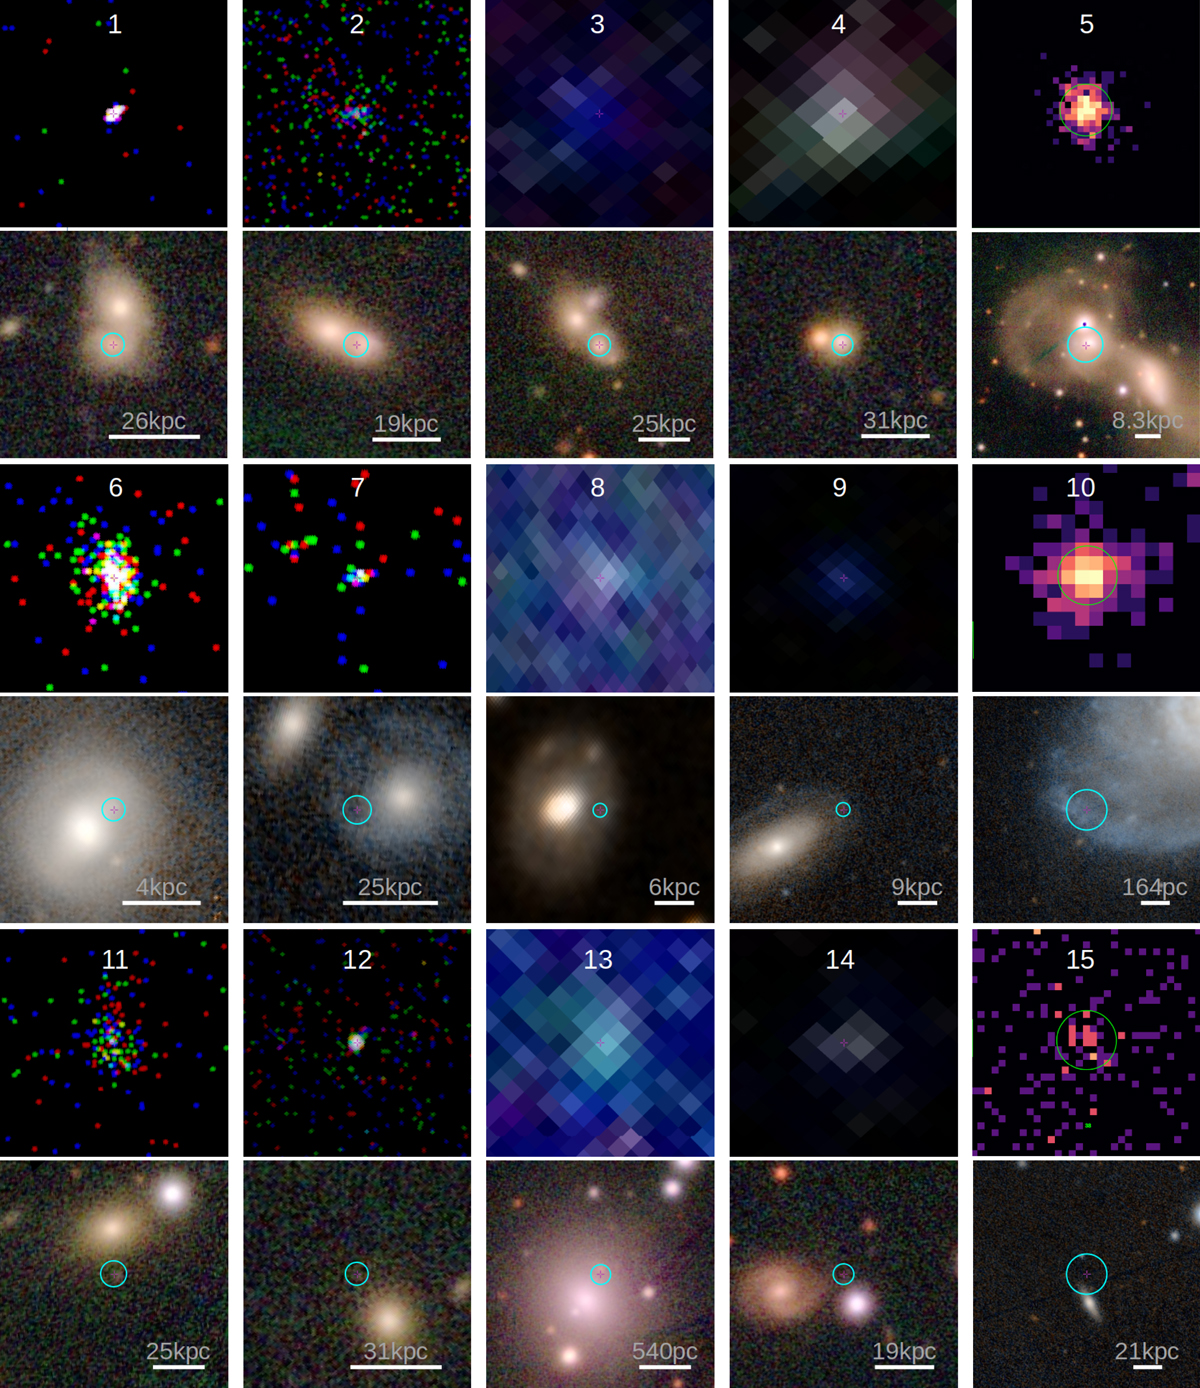
Images of a random sample of new HLX candidates. The images are structured as follows: Cols. (1,2), (3,4) and (5) display CSC2, 4XMM-DR11 and 2SXPS candidates, respectively. (odd numbers) and (even numbers) rows show the X-ray and optical image at the same scale – the white line corresponds to 10 arcsec. Rows (1,2), (3,4) and (5,6) correspond to galaxy pair, robust and weak candidates, respectively. These candidates have the following names: 1–2CXO J124208.4+331854, 2–2CXO J025921.5+132913, 3–4XMM J123441.0+020846, 4–4XMM J104444.7−012018, 5–2SXPS J164652.0+234011, 6–2CXO J082215.9+210535, 7–2CXO J105210.4+552243, 8–4XMM J062447.9−372122, 9–4XMM J125708.6−044144, 10–2SXPS J111416.1+481833, 11–2CXO J005151.7+474019, 12–2CXO J131133.3−011656, 13–4XMM J083235.2−225804, 14–4XMM J145753.6−113959 and 15–2SXPS J115109.2+570340. X-ray images correspond to the Chandra and XMM-EPIC images displayed in ESASky, or the science exposures of Swift-XRT where the green circle has a 10 arcsec radius. Optical images come from the PanSTARRS survey (Chambers et al. 2016), except candidate 8 (Digitized Sky Survey, McLean et al. 2000) as it lies in a region not covered by PanSTARRS. The 3σ X-ray position error circle is shown in cyan.
Current usage metrics show cumulative count of Article Views (full-text article views including HTML views, PDF and ePub downloads, according to the available data) and Abstracts Views on Vision4Press platform.
Data correspond to usage on the plateform after 2015. The current usage metrics is available 48-96 hours after online publication and is updated daily on week days.
Initial download of the metrics may take a while.