Fig. 7
Download original image
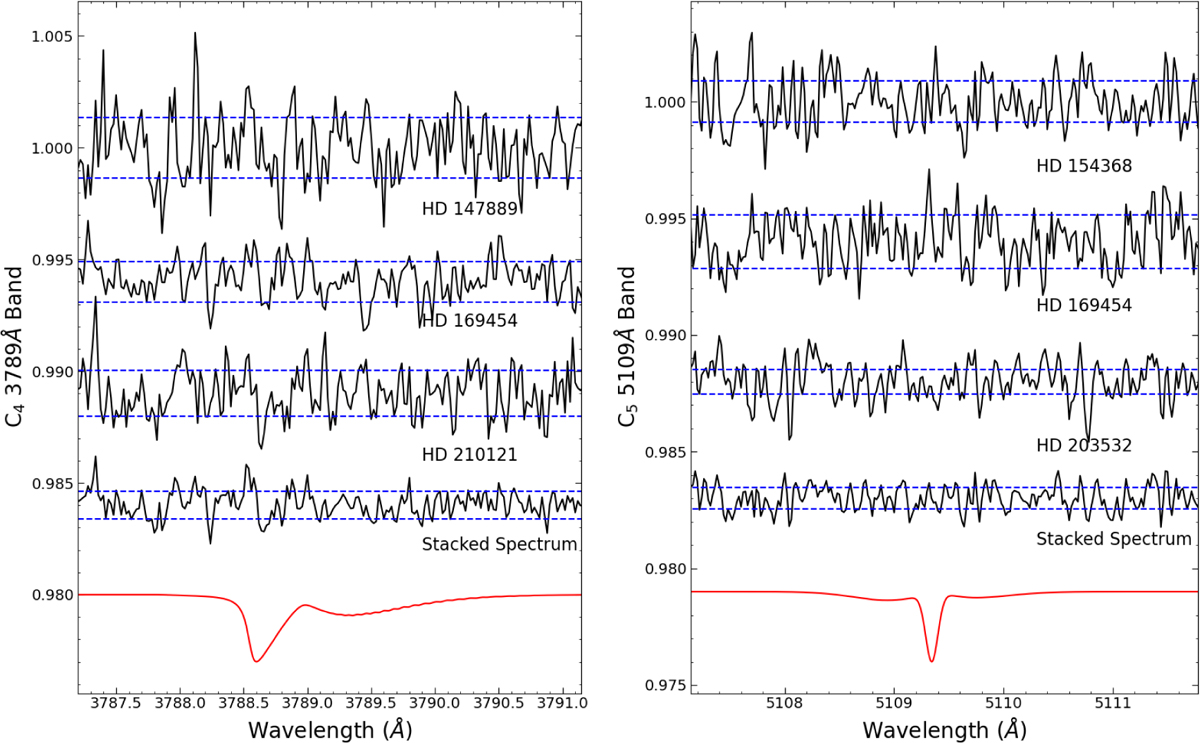
Spectral data around the C4 ![]() 3789 Å band (left) and the C5 5109 Å band, possibly from the
3789 Å band (left) and the C5 5109 Å band, possibly from the ![]() system (right). Their lab spectra are shown at the bottom as reference (red). The sightlines are selected by their measured N(C3) and the S/N of the wavelength region, which is indicated by the dashed blue lines. We cannot find the target transition in either individual sightlines nor their stacked spectrum. Upper limits on N(C4) and N(C5) can be estimated from their most prominent feature, and are around 1013 cm−2 and 1012 cm−2, respectively.
system (right). Their lab spectra are shown at the bottom as reference (red). The sightlines are selected by their measured N(C3) and the S/N of the wavelength region, which is indicated by the dashed blue lines. We cannot find the target transition in either individual sightlines nor their stacked spectrum. Upper limits on N(C4) and N(C5) can be estimated from their most prominent feature, and are around 1013 cm−2 and 1012 cm−2, respectively.
Current usage metrics show cumulative count of Article Views (full-text article views including HTML views, PDF and ePub downloads, according to the available data) and Abstracts Views on Vision4Press platform.
Data correspond to usage on the plateform after 2015. The current usage metrics is available 48-96 hours after online publication and is updated daily on week days.
Initial download of the metrics may take a while.