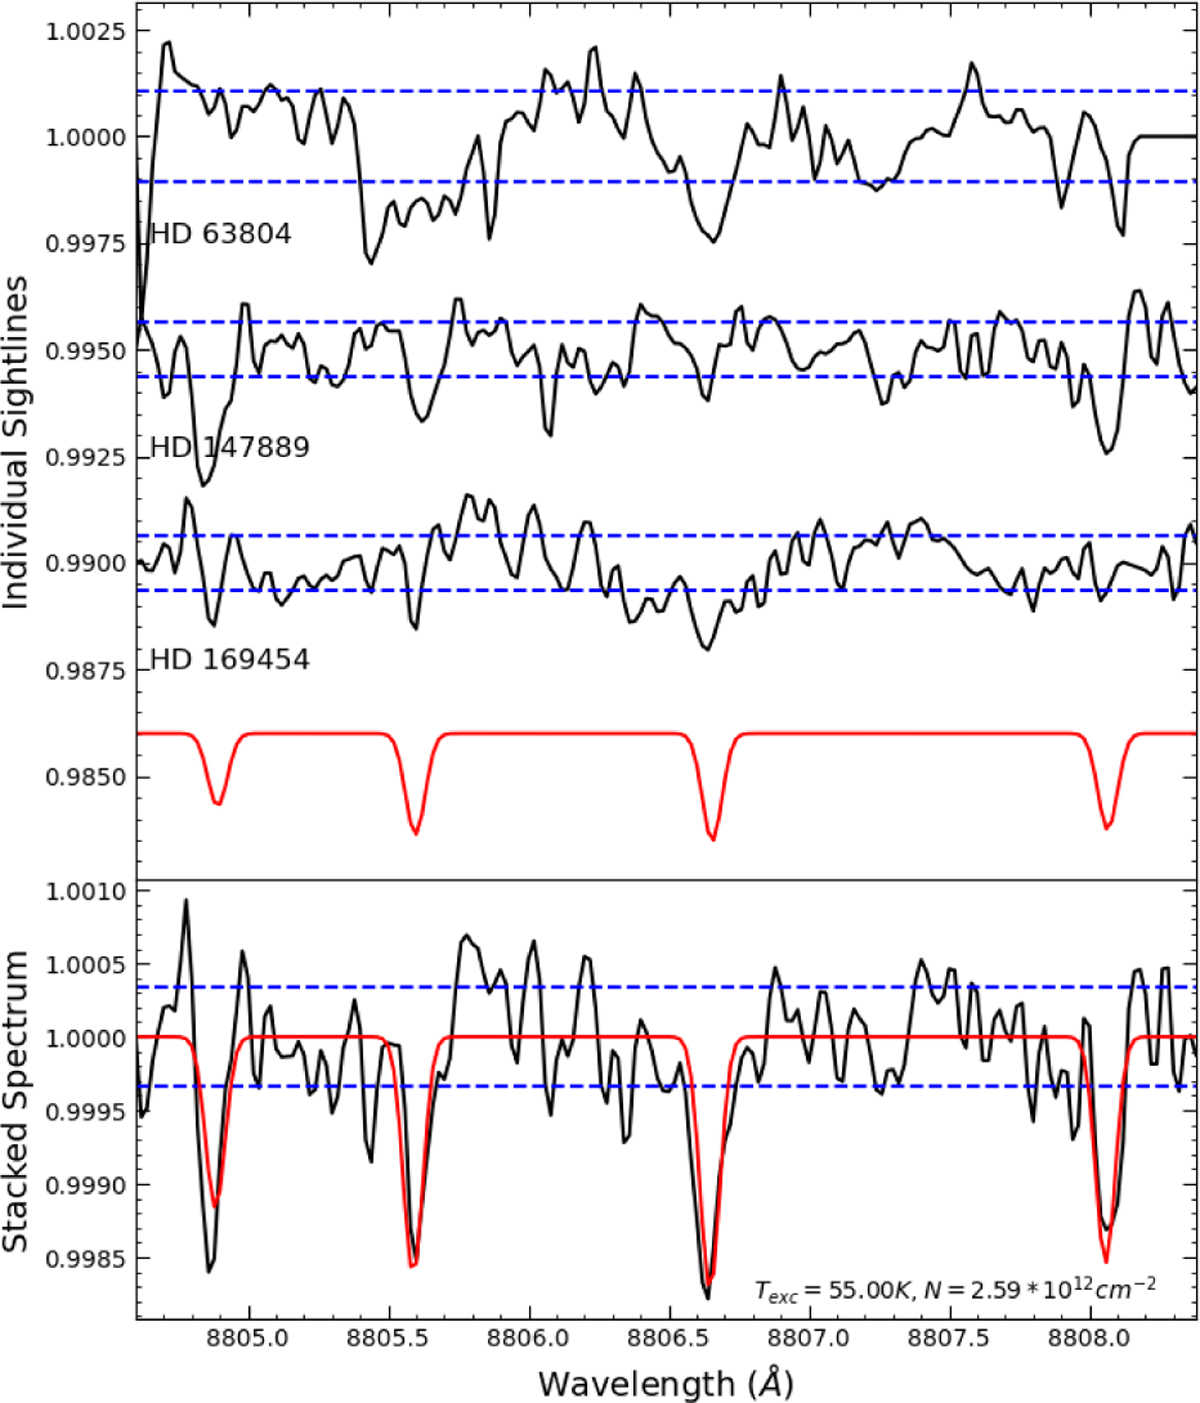
Fig. 6

Download original image
Search for 13C12C (2-0) Phillips transitions. Top panel: spectral segments of HD 63804, HD 147889, and HD 169454 around the target wavelength region, and simulated data (red) for 13C12C with Texc = 55 K. From left to right, the four transitions are Q(1), Q(2), Q(3), and Q(4). Unfortunately, we cannot identify these features in any individual sightline. Bottom panel: stacked (average) data of the three sightlines. We have a 3σ detection of the Q(2) and Q(3) transitions, and a marginal detection of the Q(4) transition. The estimated column density of 13C12C is 2.30 ± 0.31 × 1012cm−2 in the stacked spectrum, corresponding to a 12C/13C ratio of 79±8. The dashed blue lines around the spectra represent 1σ uncertainties.
Current usage metrics show cumulative count of Article Views (full-text article views including HTML views, PDF and ePub downloads, according to the available data) and Abstracts Views on Vision4Press platform.
Data correspond to usage on the plateform after 2015. The current usage metrics is available 48-96 hours after online publication and is updated daily on week days.
Initial download of the metrics may take a while.


