Fig. 4
Download original image
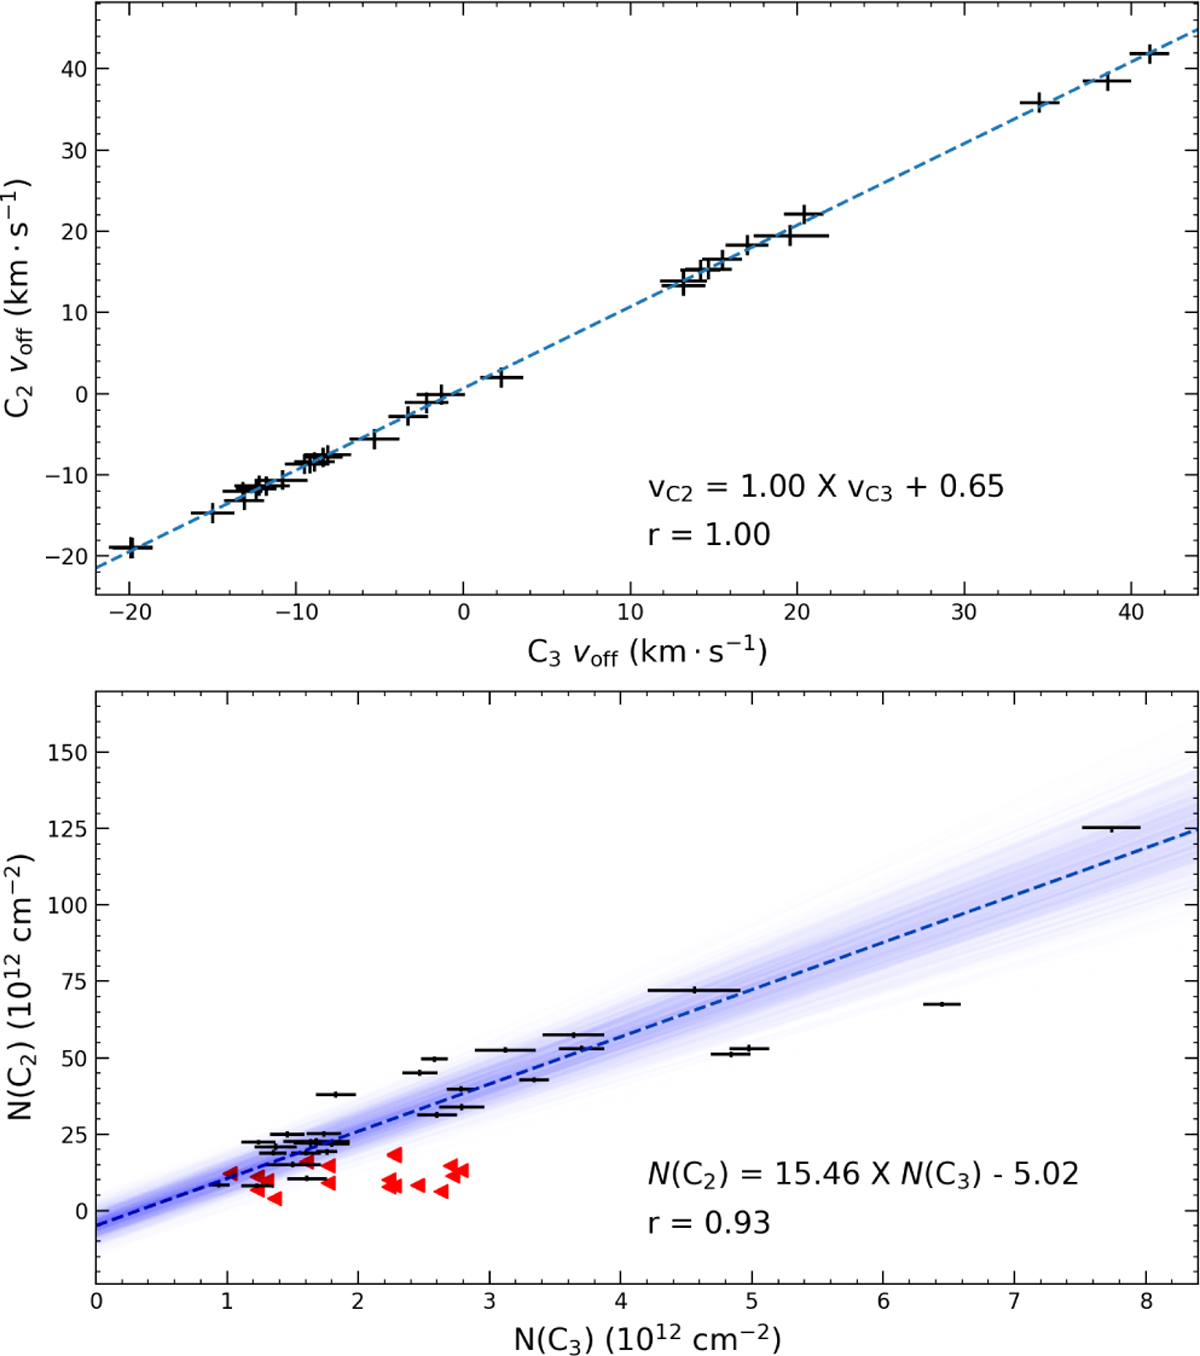
Comparison between the C2 and C3 measurements. Each point represents a velocity component for which both molecules are detected. Upper panel: The velocity offsets of C2 and C3 (relative to the barycentric frame) are well aligned, suggesting the two molecules are detected in the same velocity component. Lower panel: N(C2) and N(C3) have a good correlation, with r = 0.93. The dashed blue line represents the best linear fit from orthogonal distance regression. The 1σ confidence interval of the fit is shown as the shadow. The red triangles represent the 3σ upper limits of N(C3) in velocity components without C3 detection. These upper limits are not considered in the linear regression.
Current usage metrics show cumulative count of Article Views (full-text article views including HTML views, PDF and ePub downloads, according to the available data) and Abstracts Views on Vision4Press platform.
Data correspond to usage on the plateform after 2015. The current usage metrics is available 48-96 hours after online publication and is updated daily on week days.
Initial download of the metrics may take a while.