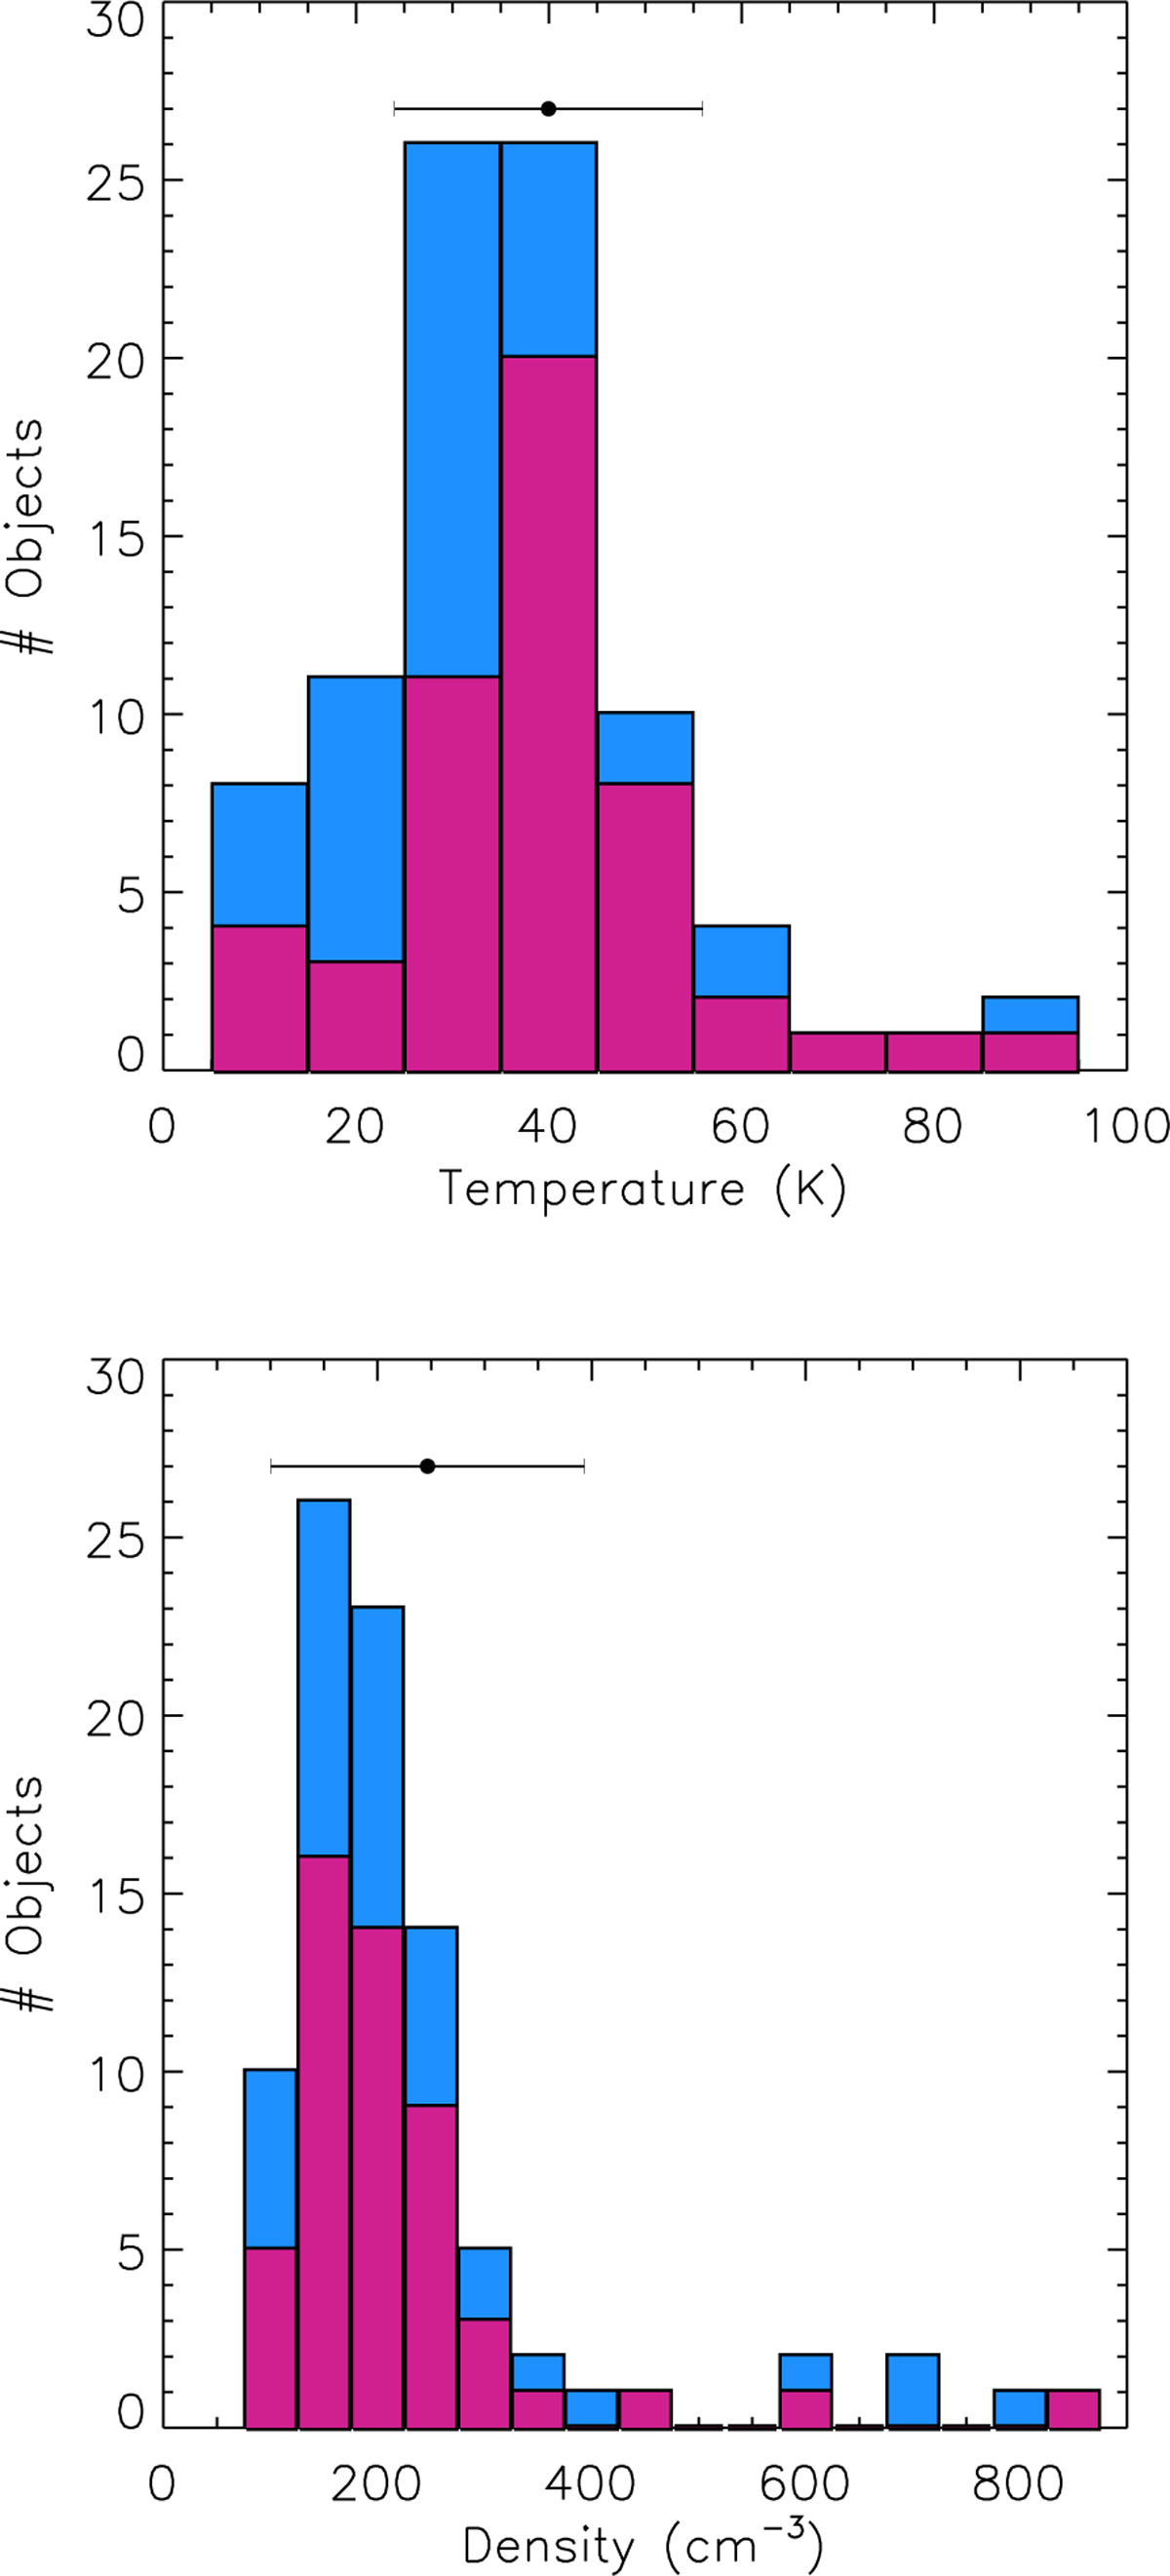
Fig. 2
Download original image
Histograms of the kinetic temperatures (top) and densities (bottom) in C2-bearing clouds. In both panels, the red histogram represents the values determined in this study; the blue histogram also includes literature values (see Table C.1). The single data point with an error bar indicates the (unweighted) average of all values and the standard deviation.
Current usage metrics show cumulative count of Article Views (full-text article views including HTML views, PDF and ePub downloads, according to the available data) and Abstracts Views on Vision4Press platform.
Data correspond to usage on the plateform after 2015. The current usage metrics is available 48-96 hours after online publication and is updated daily on week days.
Initial download of the metrics may take a while.