Fig. 1
Download original image
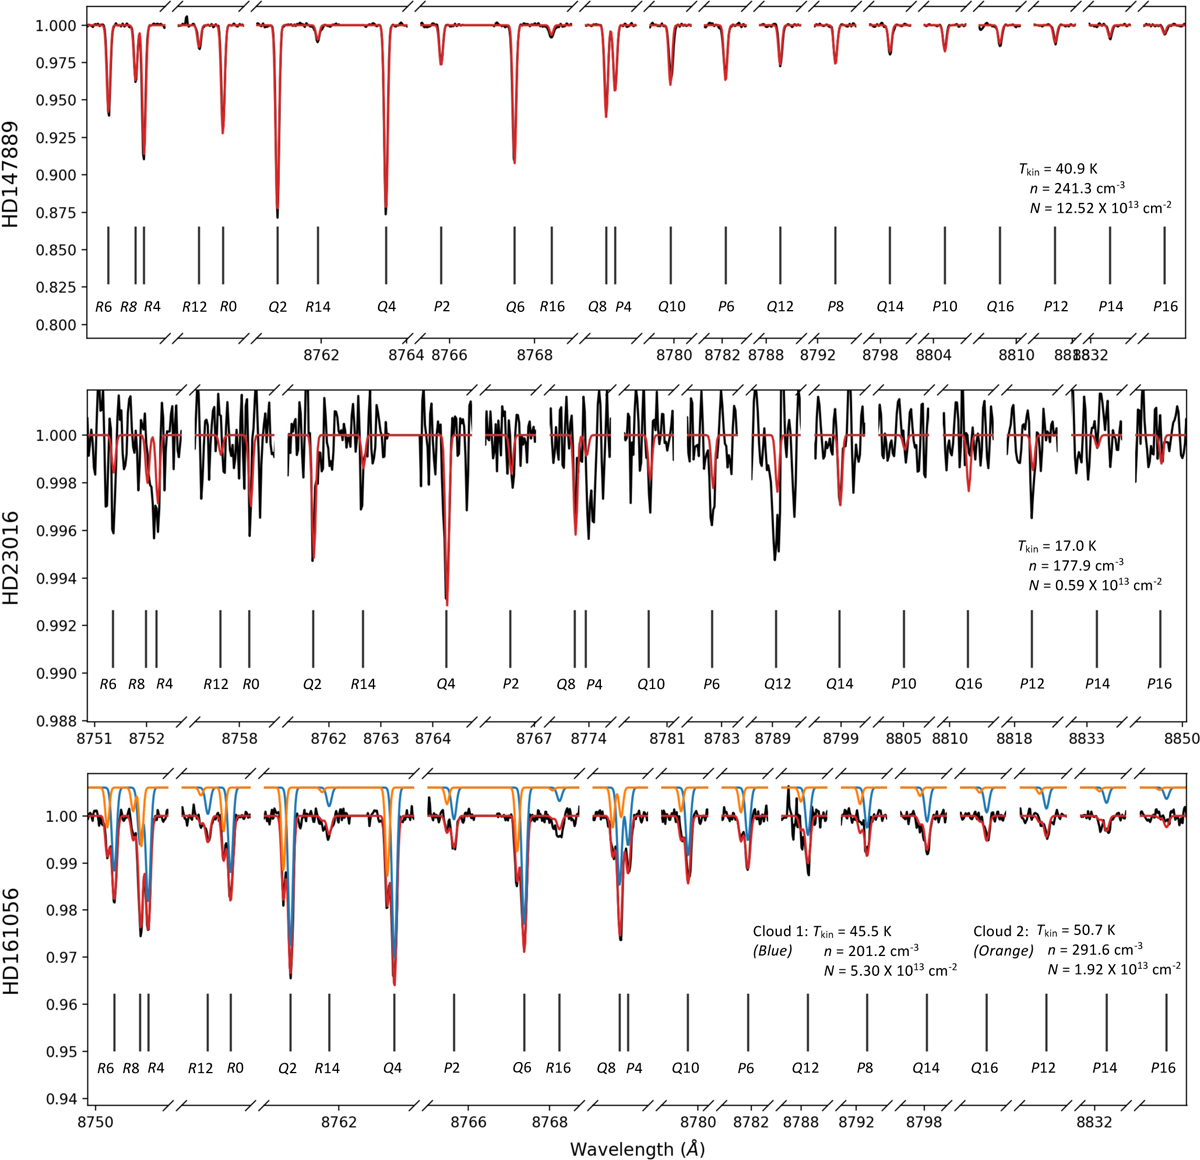
Spectral segments from three representative sightlines for the C2 (A-X) Phillips (2-0) band. HD 147889 (top) has the highest C2 column density in our data sample. HD 23016 (middle) shows a tentative detection, as the strongest Q(4) line is still below the 3σ detection limit. We considered multiple rotational lines simultaneously when deciding about possible identifications. The C2 molecules are detected in two velocity components in HD 161056 (bottom). The combined model (red) is plotted against the spectral data, while synthetic spectra for the two velocity components (blue and orange) are plotted separately with an offset. We focus on the spectral segments around the C2 transitions, and the wavelength grid is hence discrete. Rotational lines being considered in each sightline may differ due to telluric interference and/or data quality. These rotational lines are labelled with vertical bars. The best-fit parameters for the kinetic temperature, Tkin, number density, n, and the column density of the velocity component, N, are listed in each panel.
Current usage metrics show cumulative count of Article Views (full-text article views including HTML views, PDF and ePub downloads, according to the available data) and Abstracts Views on Vision4Press platform.
Data correspond to usage on the plateform after 2015. The current usage metrics is available 48-96 hours after online publication and is updated daily on week days.
Initial download of the metrics may take a while.