Open Access
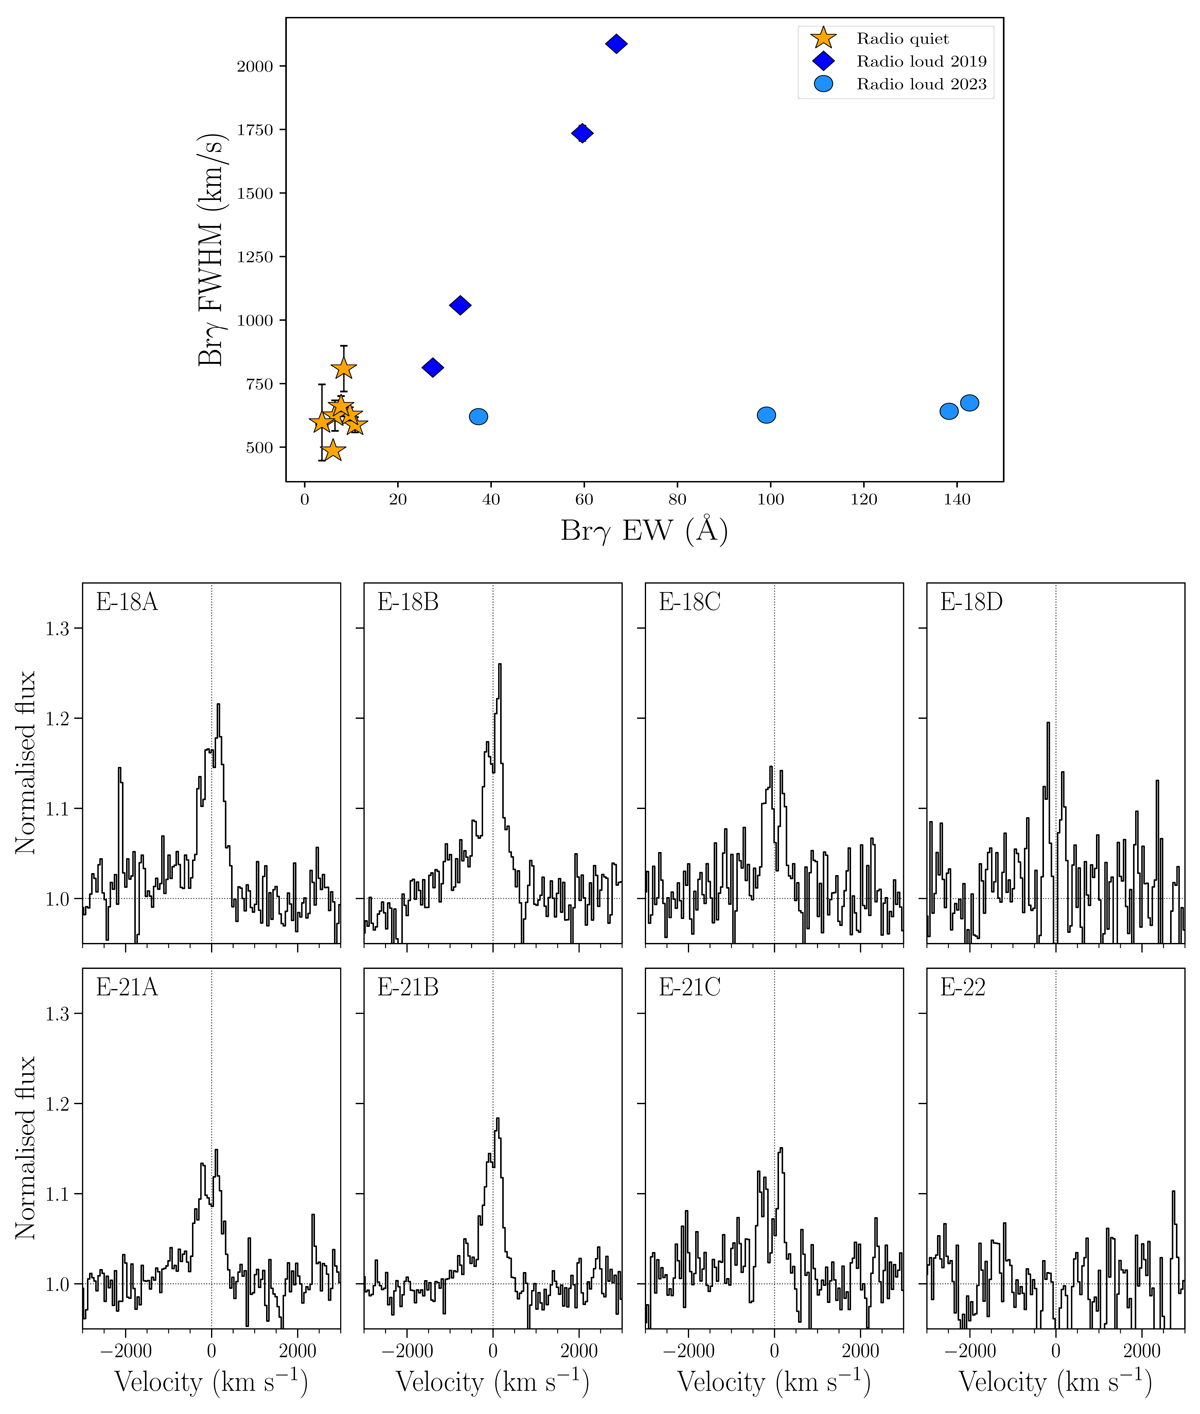
Fig. 2.
Download original image
Evolution of the Brγ emission line. Top panel: EW vs. FWHM for Brγ line. Bottom panels: Evolution of the Brγ line profile as observed by GTC/EMIR. We note that E-22 corresponds to the mean of the data from the three 2022 epochs.
Current usage metrics show cumulative count of Article Views (full-text article views including HTML views, PDF and ePub downloads, according to the available data) and Abstracts Views on Vision4Press platform.
Data correspond to usage on the plateform after 2015. The current usage metrics is available 48-96 hours after online publication and is updated daily on week days.
Initial download of the metrics may take a while.