Open Access
Fig. 1.
Download original image
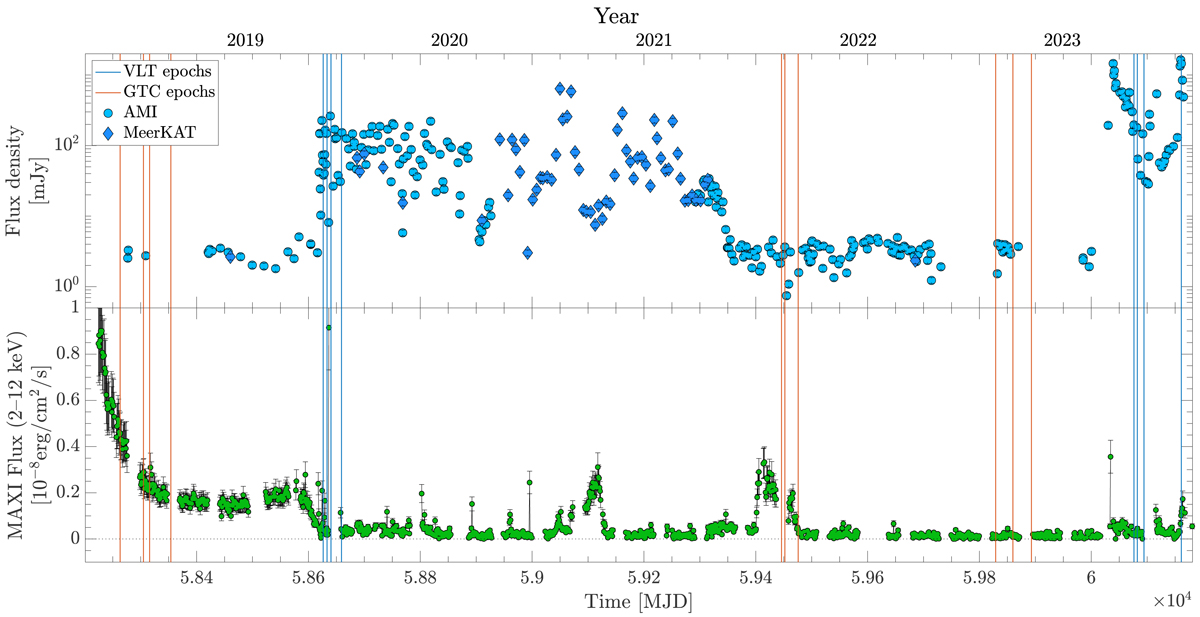
Light curves in radio (MeerKAT and AMI; top panel) and X-rays (MAXI; bottom panel) from March 2018 (MJD 58200) to August 2023 (MJD 60170). Vertical lines indicate the spectroscopic epochs of GTC/EMIR (orange) and VLT/X-shooter (blue).
Current usage metrics show cumulative count of Article Views (full-text article views including HTML views, PDF and ePub downloads, according to the available data) and Abstracts Views on Vision4Press platform.
Data correspond to usage on the plateform after 2015. The current usage metrics is available 48-96 hours after online publication and is updated daily on week days.
Initial download of the metrics may take a while.