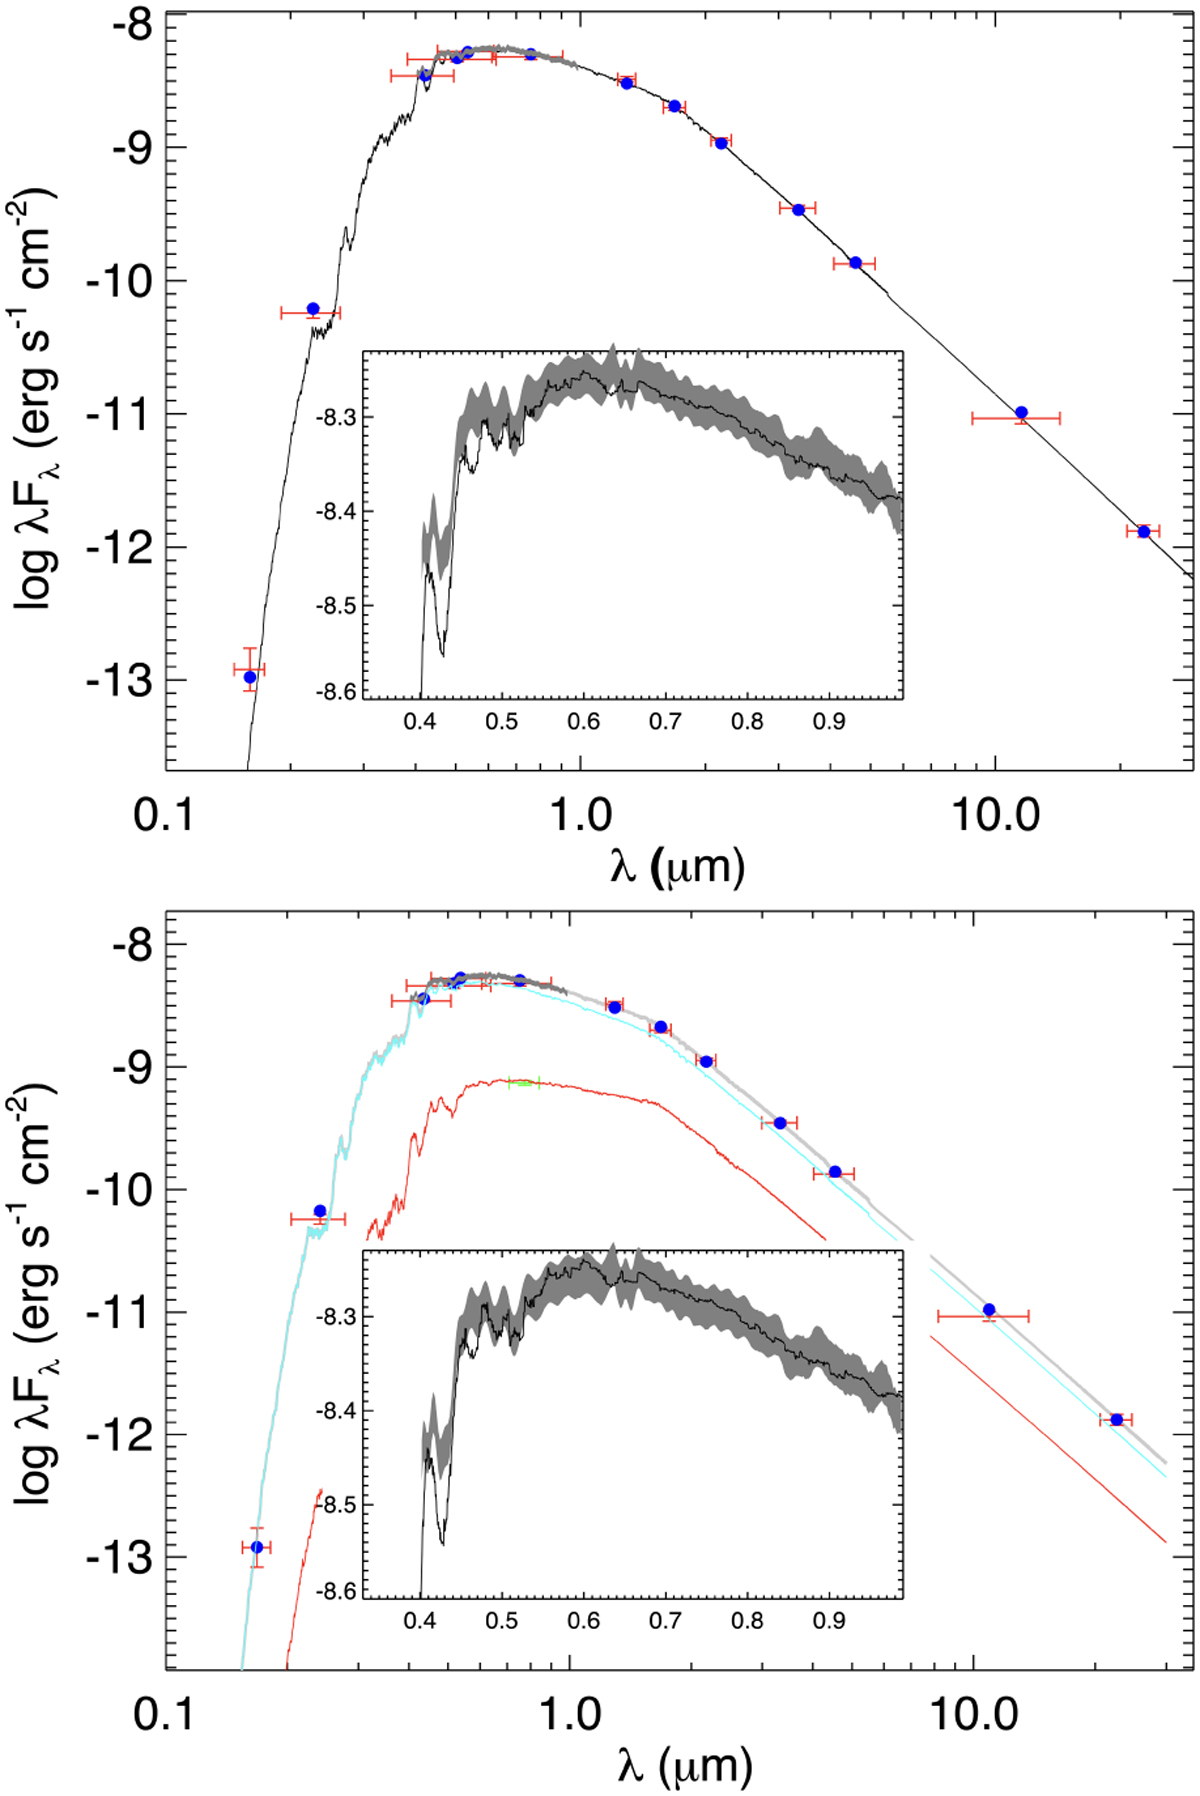
Fig. 5
Download original image
SED fit analysis for TOI-1736. The upper panel shows results assuming a single stellar component and the lower panel shows results assuming two stellar components. The red symbols represent the observed photometric measurements, whereas the horizontal bars represent the effective passband width. The blue symbols are the model fluxes from the best-fit NextGen atmosphere model (black and gray lines). The lower panel also shows the model for the primary component (cyan line) and the secondary component (red line), separately. The insets display our model (black curve) and the observed absolute flux-calibrated Gaia spectrum (gray swathe).
Current usage metrics show cumulative count of Article Views (full-text article views including HTML views, PDF and ePub downloads, according to the available data) and Abstracts Views on Vision4Press platform.
Data correspond to usage on the plateform after 2015. The current usage metrics is available 48-96 hours after online publication and is updated daily on week days.
Initial download of the metrics may take a while.