Fig. C.4
Download original image
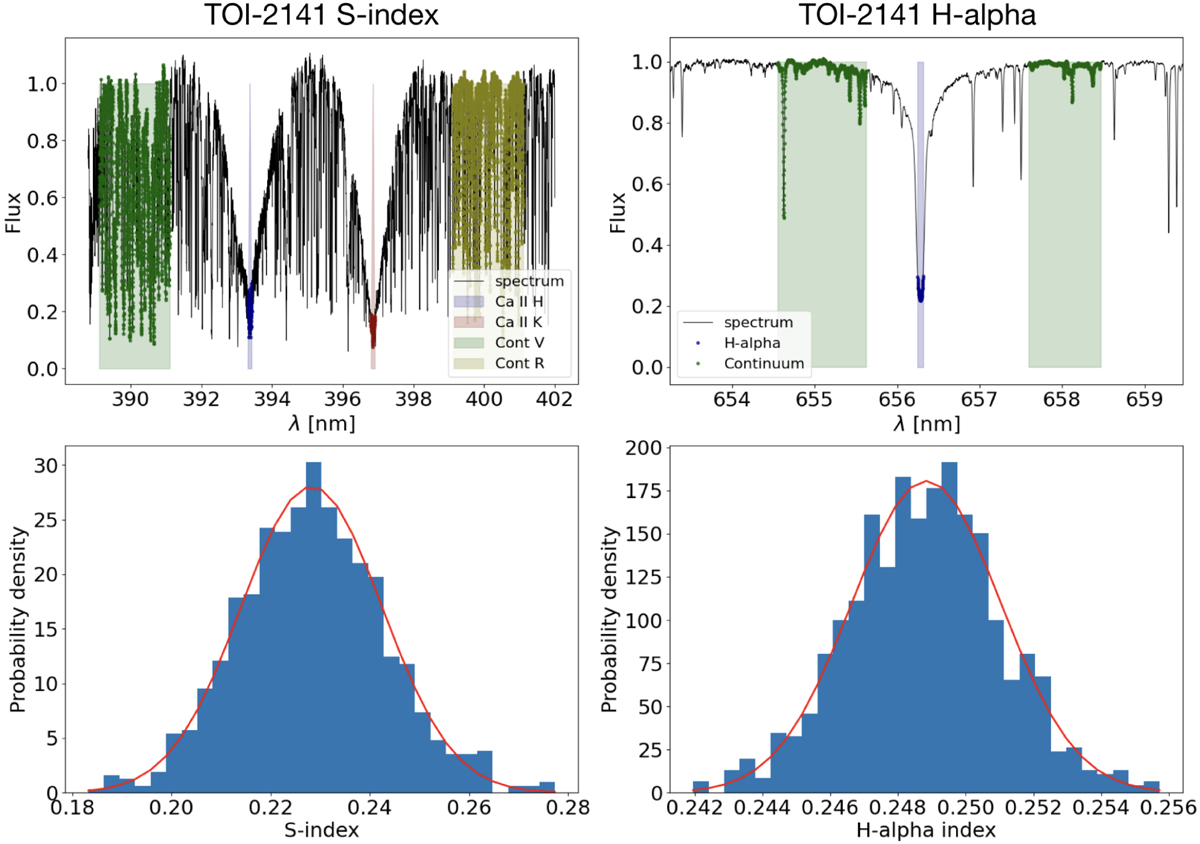
TOI-2141 measurements of S-index and Hα from SOPHIE spectra. The top panels show the SOPHIE template spectrum around the S-index and Hα regions, showing the integration windows for the core of lines and continuum regions. The bottom panels show the posterior distribution obtained from the Monte Carlo samples calculated in the measurement of each quantity.
Current usage metrics show cumulative count of Article Views (full-text article views including HTML views, PDF and ePub downloads, according to the available data) and Abstracts Views on Vision4Press platform.
Data correspond to usage on the plateform after 2015. The current usage metrics is available 48-96 hours after online publication and is updated daily on week days.
Initial download of the metrics may take a while.