Fig. C.1
Download original image
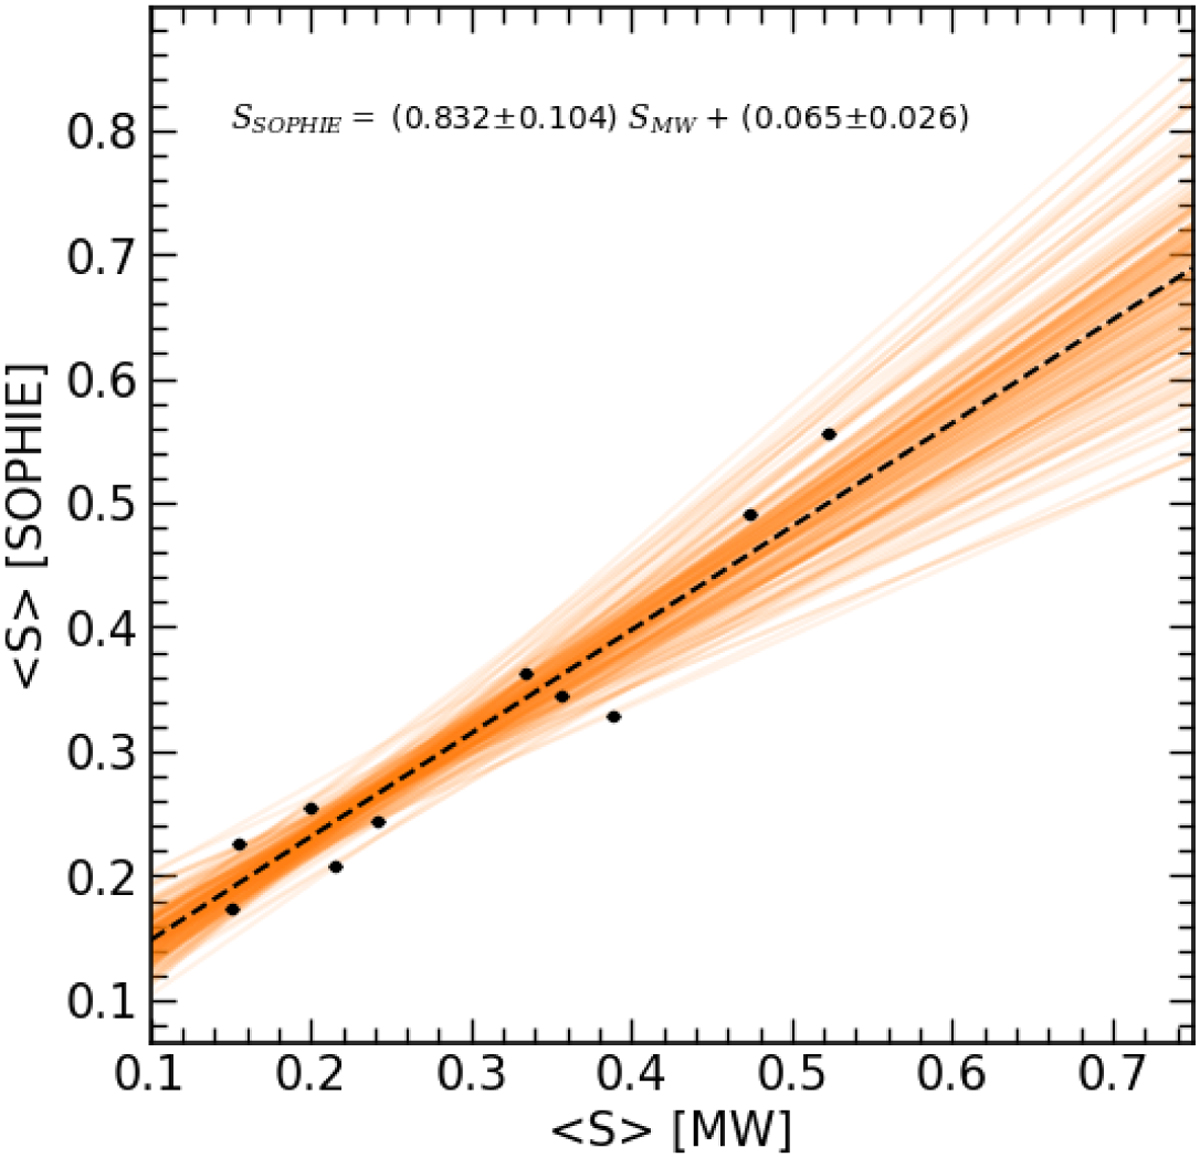
Calibration of S-index from the SOPHIE HR spectra. Black points show the S-index for several targets (see Table measured from the SOPHIE HR spectrum as a function of the reference MW values. The orange lines show a randomly selected sample of the fit models obtained from a posterior distribution of the model parameters, and the dashed black line show the median linear model.
Current usage metrics show cumulative count of Article Views (full-text article views including HTML views, PDF and ePub downloads, according to the available data) and Abstracts Views on Vision4Press platform.
Data correspond to usage on the plateform after 2015. The current usage metrics is available 48-96 hours after online publication and is updated daily on week days.
Initial download of the metrics may take a while.