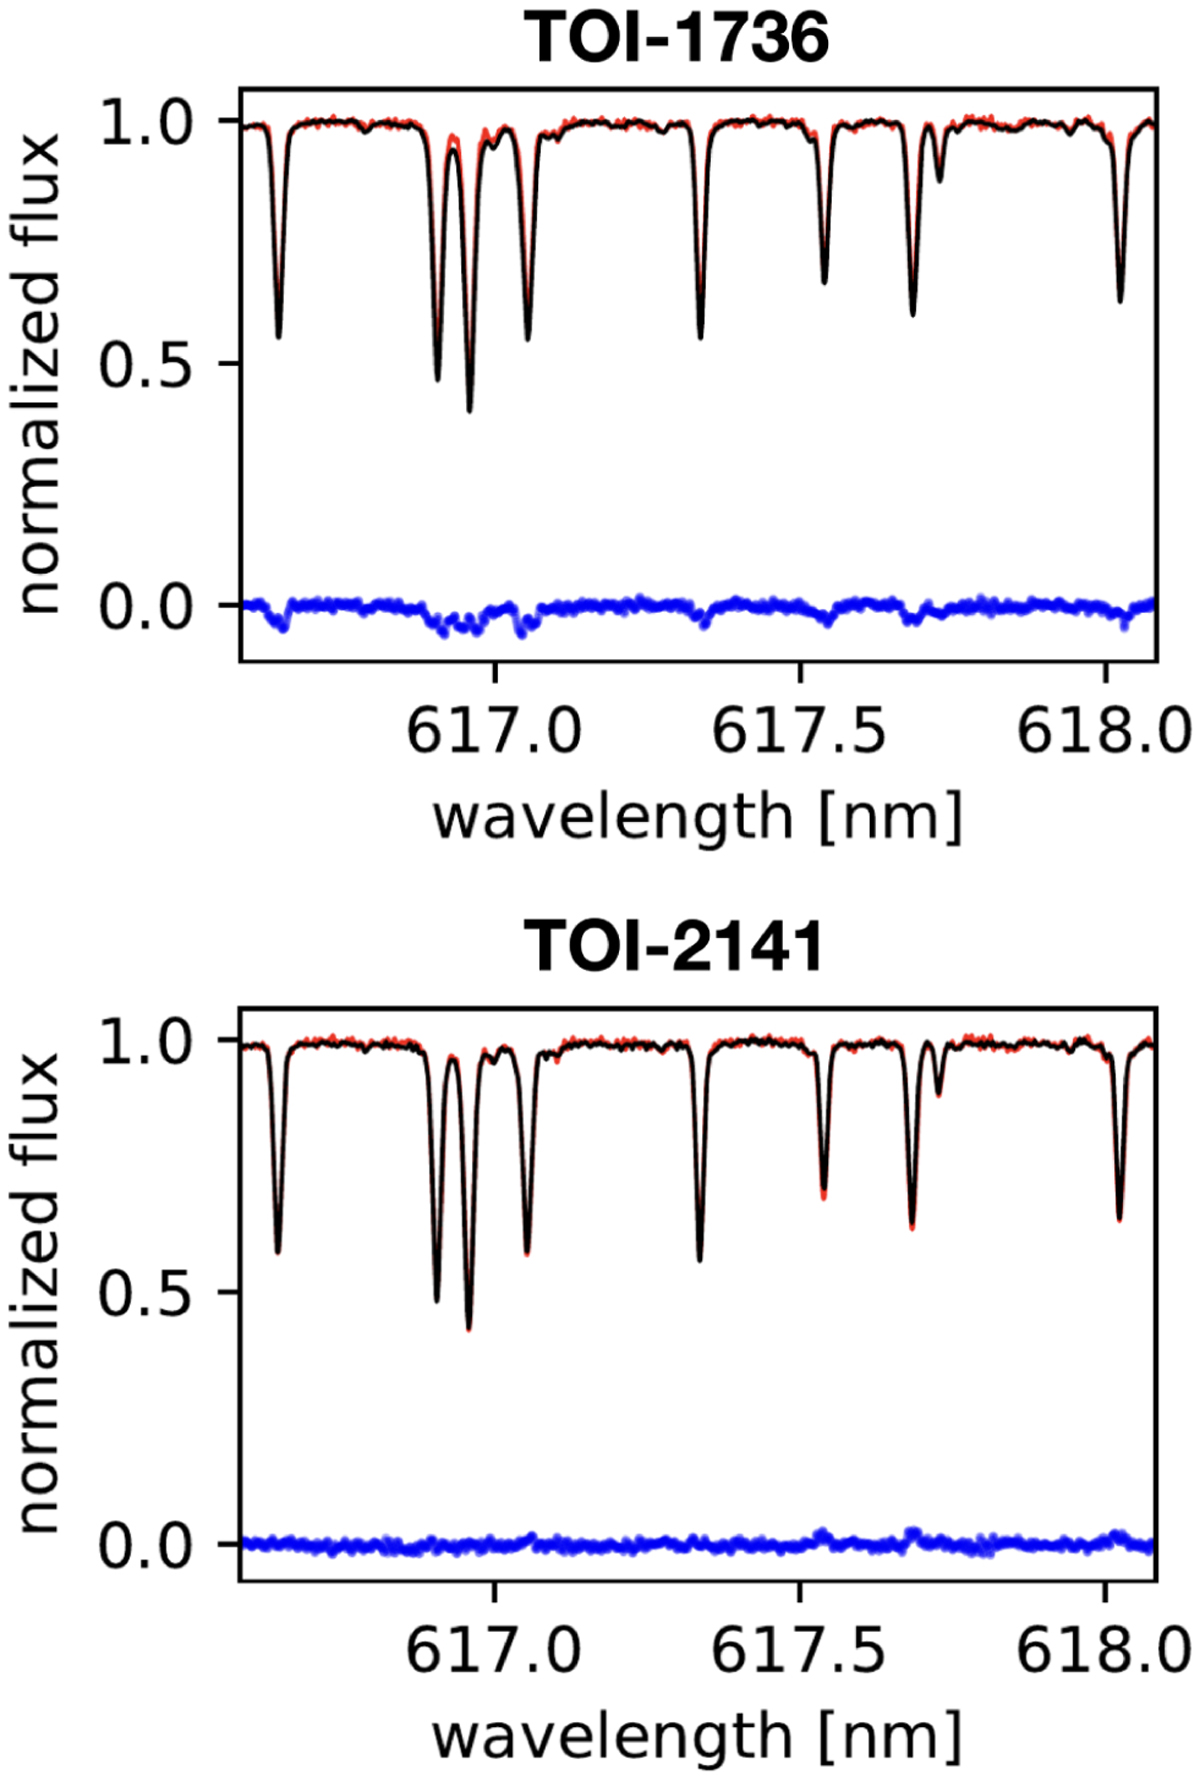
Fig. B.1
Download original image
Visual spectral differences between stellar and solar spectra. Solid red lines show the solar spectrum used in this work as the reference spectrum for the strictly differential analysis. The black solid lines show the stellar spectrum for TOI-1736 (upper panel) and TOI-2141 (bottom panel), and the blue points show the respective spectral differences between stellar and solar normalized fluxes.
Current usage metrics show cumulative count of Article Views (full-text article views including HTML views, PDF and ePub downloads, according to the available data) and Abstracts Views on Vision4Press platform.
Data correspond to usage on the plateform after 2015. The current usage metrics is available 48-96 hours after online publication and is updated daily on week days.
Initial download of the metrics may take a while.