Open Access
Fig. 20
Download original image
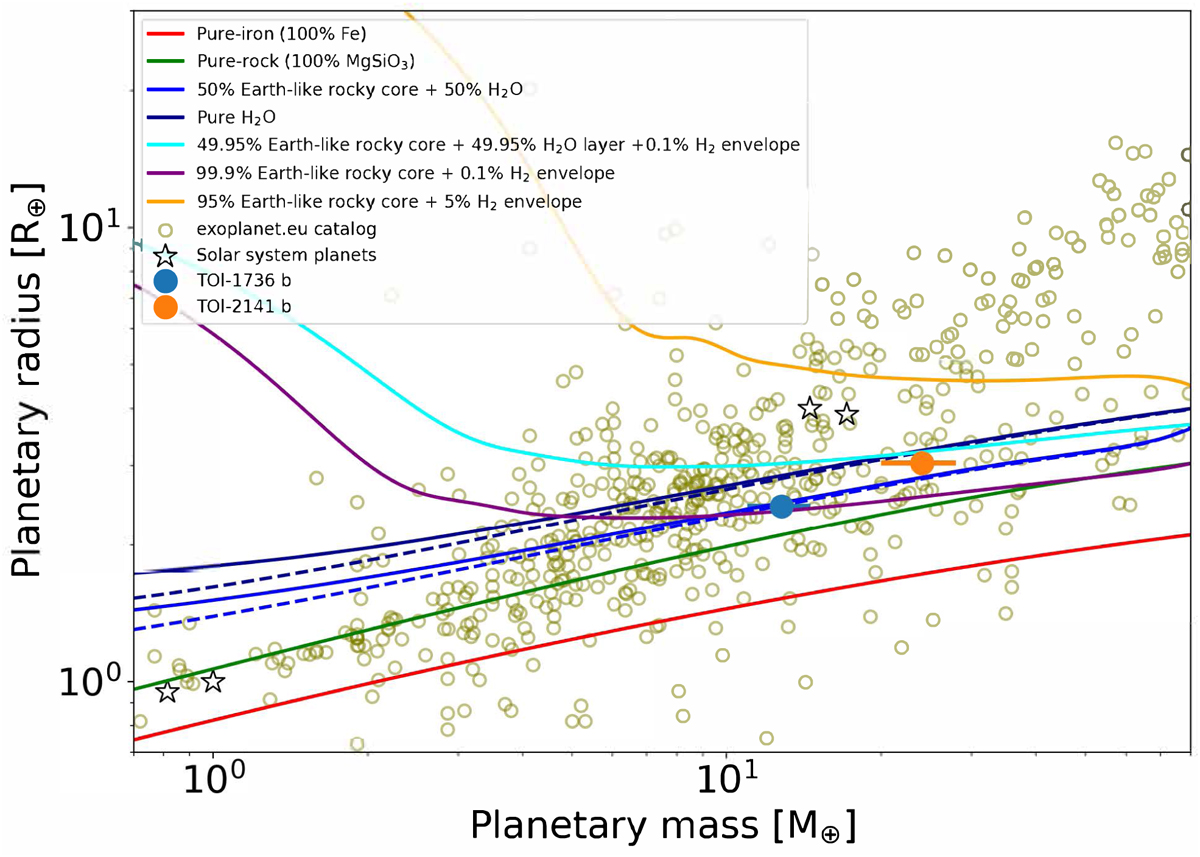
Mass-radius diagram. The green circles show the exoplanet data from exoplanets.eu, the black stars show the Solar System planets and the blue and orange points show the measured values for TOI-1736 b and TOI-2141 b, respectively. Several models from Zeng et al. (2019) are also plotted for comparison.
Current usage metrics show cumulative count of Article Views (full-text article views including HTML views, PDF and ePub downloads, according to the available data) and Abstracts Views on Vision4Press platform.
Data correspond to usage on the plateform after 2015. The current usage metrics is available 48-96 hours after online publication and is updated daily on week days.
Initial download of the metrics may take a while.