Fig. 14
Download original image
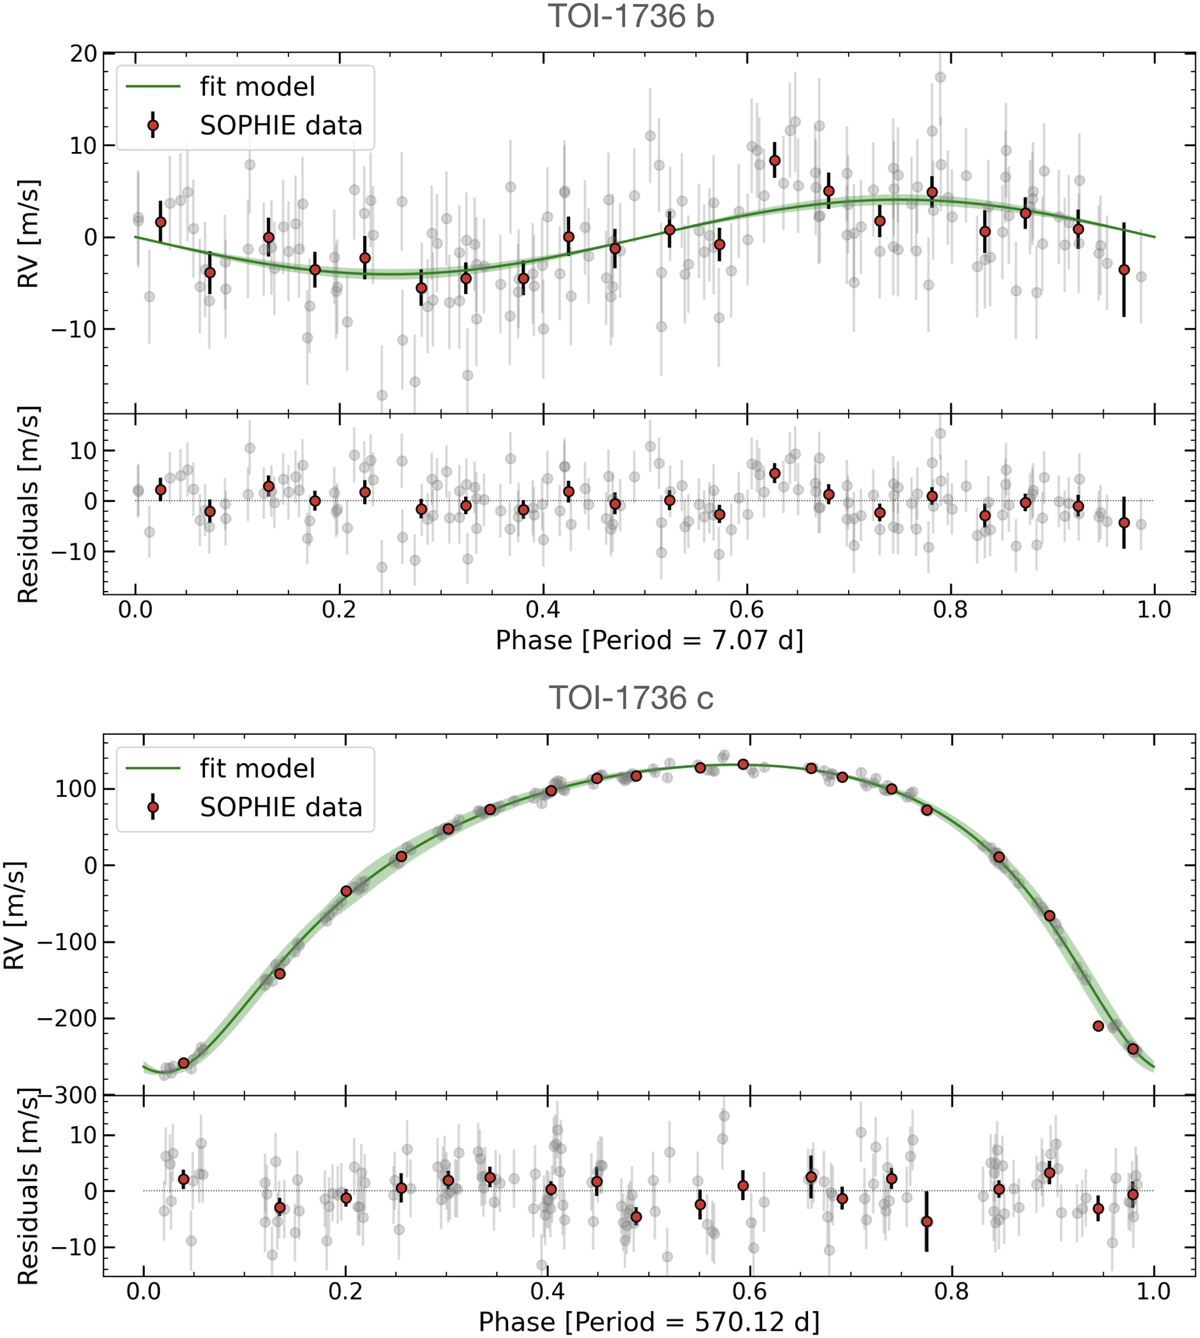
TOI-1736 SOPHIE RVs in phase with the orbits of the planets. In the top panel, the gray points show the RVs phase-folded in the period of planet b, where the orbit of planet c and the linear trend have been subtracted. In the bottom panel, the gray points show the RVs phase-folded in the period of planet c, where the orbit of planet b and the linear trend has been subtracted. The red points show the binned data, where we use a bin size of 0.05 in units of orbital phase. The green lines represent the best-fit orbit model for each respective planet.
Current usage metrics show cumulative count of Article Views (full-text article views including HTML views, PDF and ePub downloads, according to the available data) and Abstracts Views on Vision4Press platform.
Data correspond to usage on the plateform after 2015. The current usage metrics is available 48-96 hours after online publication and is updated daily on week days.
Initial download of the metrics may take a while.