Open Access
Fig. 13
Download original image
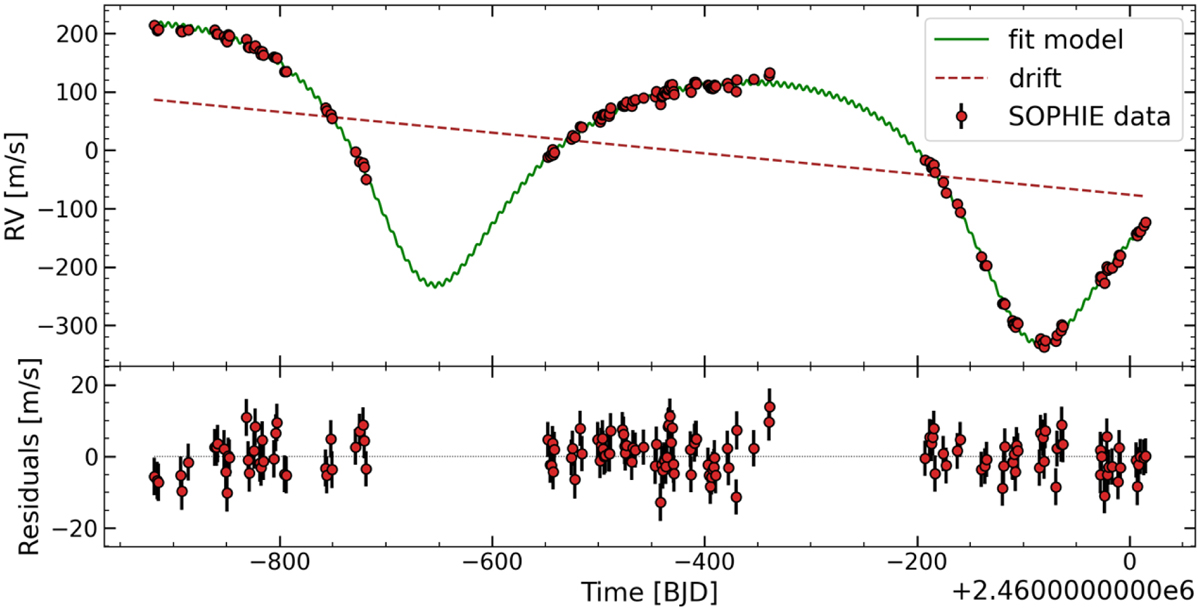
TOI-1736 SOPHIE RVs. In the top panel, the red points show the SOPHIE RV data and the green line shows the best-fit model, including the orbits of TOI-1736 b and TOI-1736 c, plus a linear trend, which is also represented separately by the red dashed line. The bottom panel shows the residuals.
Current usage metrics show cumulative count of Article Views (full-text article views including HTML views, PDF and ePub downloads, according to the available data) and Abstracts Views on Vision4Press platform.
Data correspond to usage on the plateform after 2015. The current usage metrics is available 48-96 hours after online publication and is updated daily on week days.
Initial download of the metrics may take a while.