Open Access
Fig. 12
Download original image
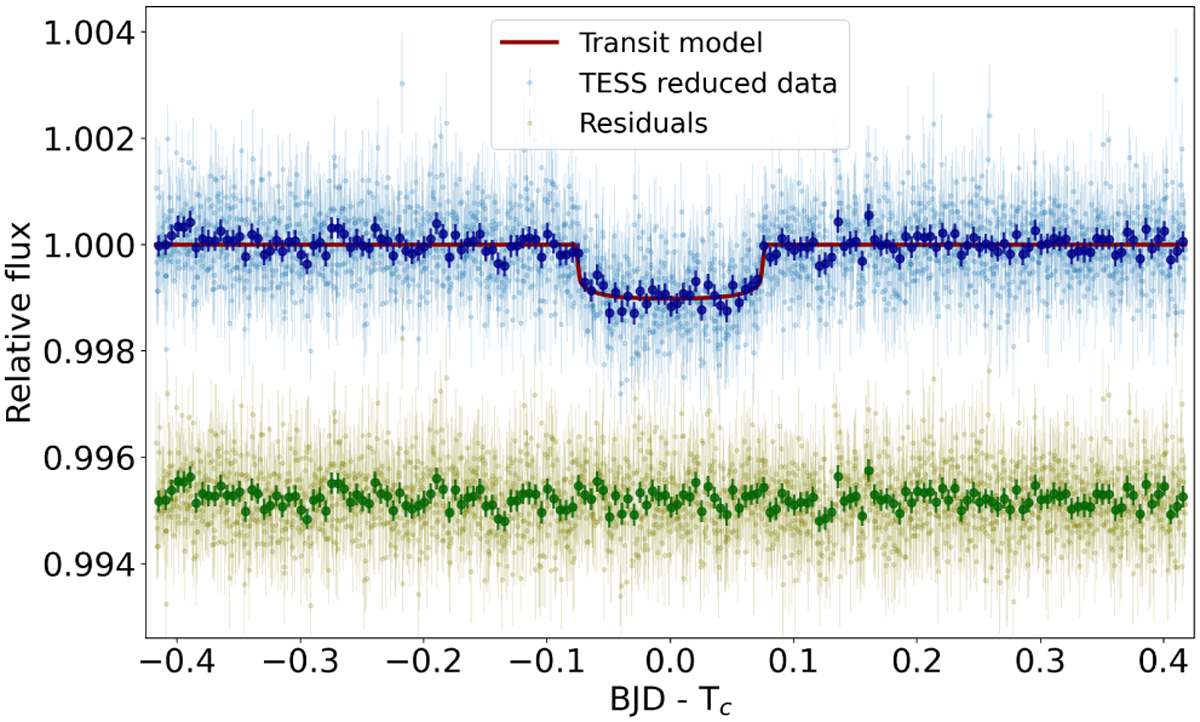
Transits of TOI-2141 b observed by TESS. The blue points show the TESS photometry data around the four transits of TOI-2141 b, with the times relative to the central time of each transit. The red line shows the best-fit transit model and the green points show the residuals plus an arbitrary offset for better visualization.
Current usage metrics show cumulative count of Article Views (full-text article views including HTML views, PDF and ePub downloads, according to the available data) and Abstracts Views on Vision4Press platform.
Data correspond to usage on the plateform after 2015. The current usage metrics is available 48-96 hours after online publication and is updated daily on week days.
Initial download of the metrics may take a while.