Open Access
Fig. 2.
Download original image
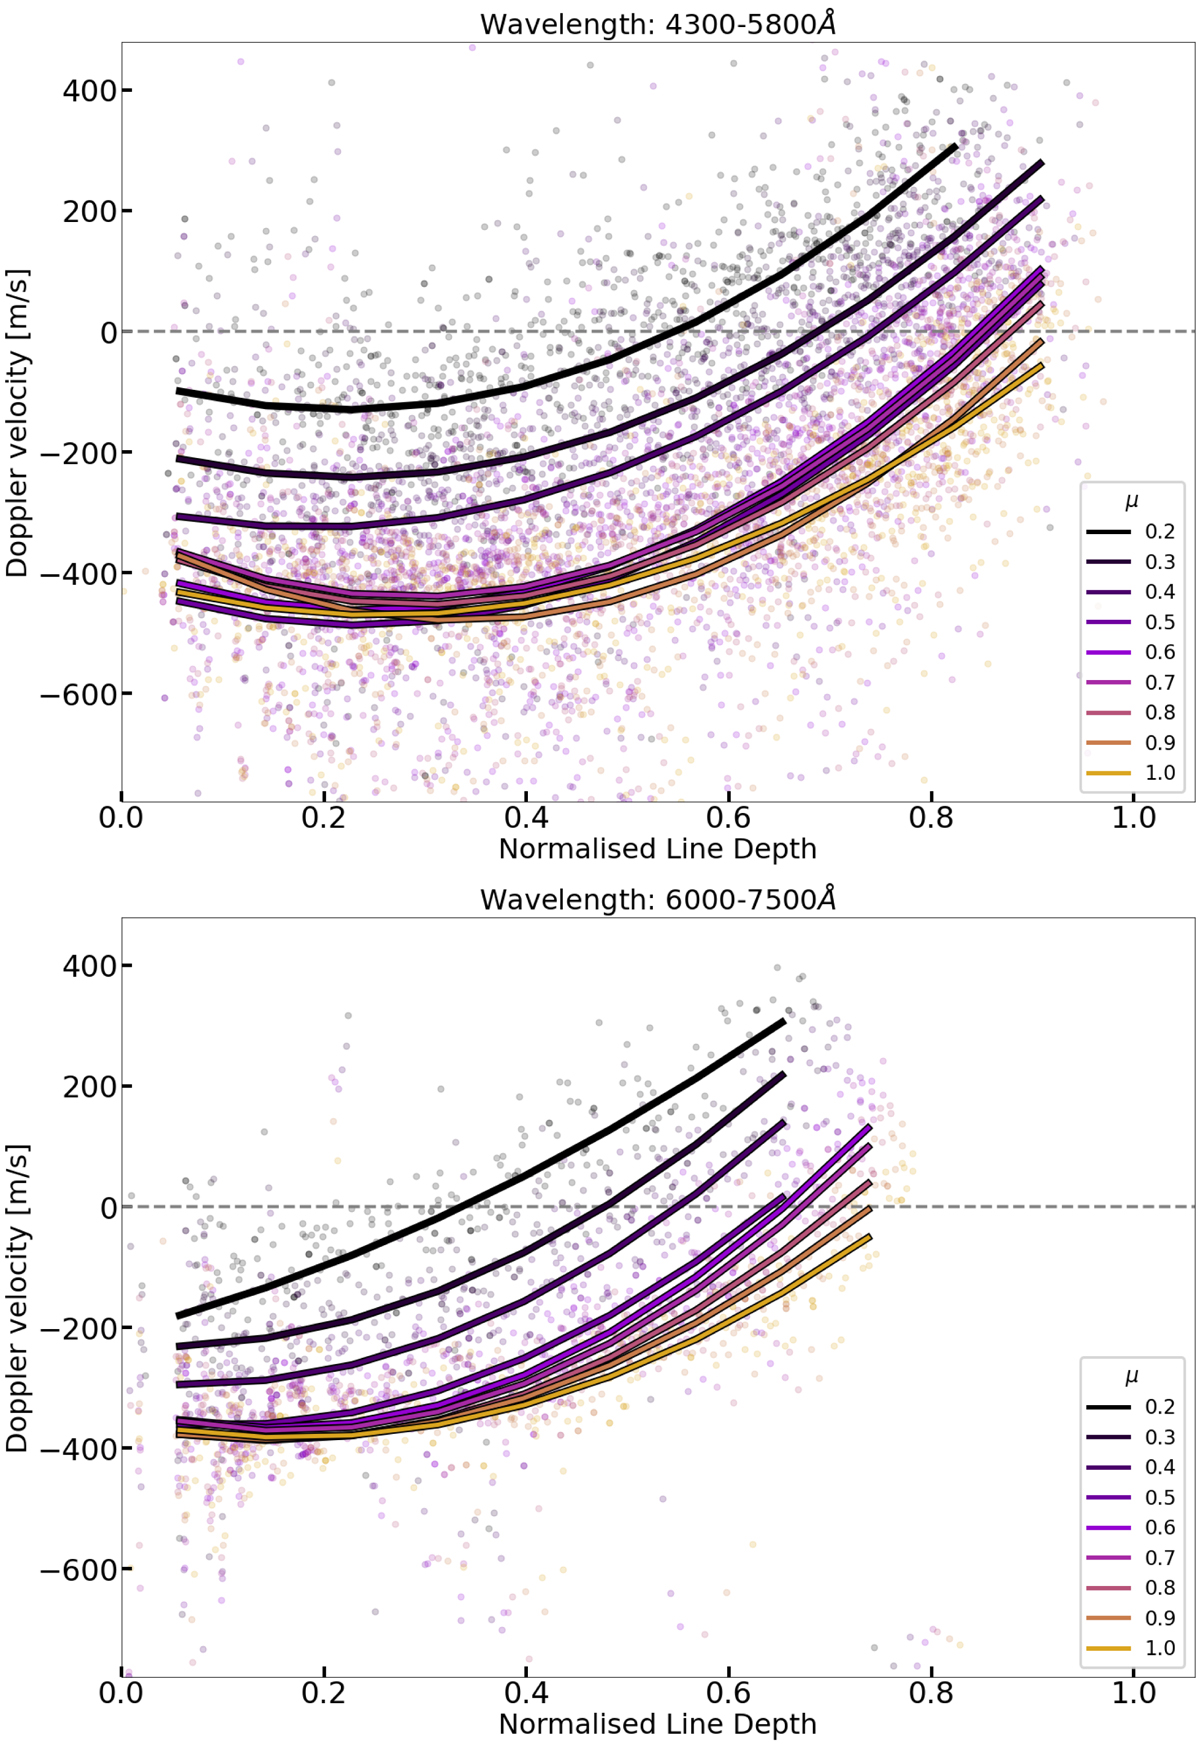
Doppler velocity as a function of line depth of Fe I lines, for various μ positions. The dots show the individual Doppler velocities of the lines while the lines show the corresponding fits to each μ. Upper: wavelength range (4300 − 5800) Å. Lower: wavelength range (6000 − 7500) Å.
Current usage metrics show cumulative count of Article Views (full-text article views including HTML views, PDF and ePub downloads, according to the available data) and Abstracts Views on Vision4Press platform.
Data correspond to usage on the plateform after 2015. The current usage metrics is available 48-96 hours after online publication and is updated daily on week days.
Initial download of the metrics may take a while.