Fig. 1.
Download original image
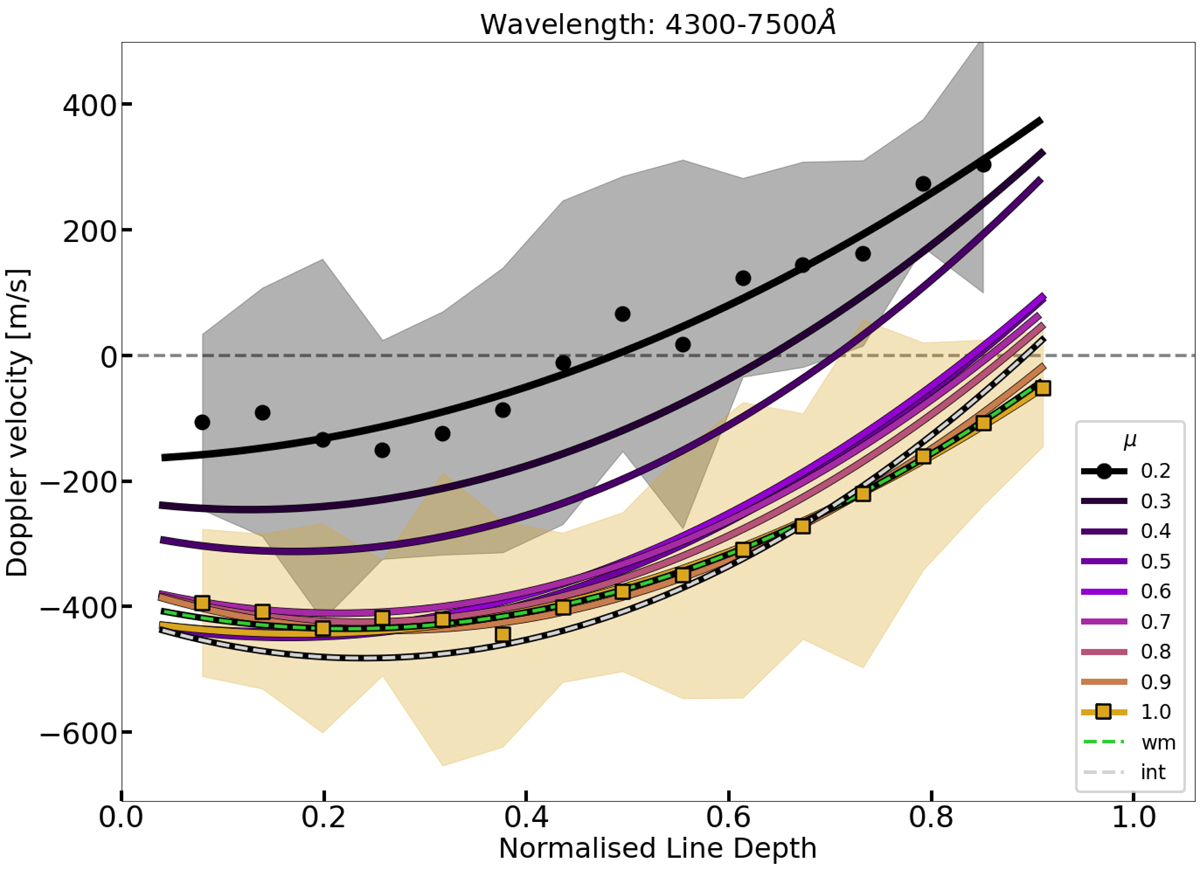
Fitted Doppler velocity as a function of line depth of Fe I lines for various μ positions. The weighted mean (“wm”) of these μ positions is also displayed. Velocities obtained from the integrated IAG atlas (“int”) are presented for comparison. For μ = 1.0 and μ = 0.2, we show binned data points of line depth of chunks of 0.06. The shaded areas represent the standard deviation of the bins for those μs.
Current usage metrics show cumulative count of Article Views (full-text article views including HTML views, PDF and ePub downloads, according to the available data) and Abstracts Views on Vision4Press platform.
Data correspond to usage on the plateform after 2015. The current usage metrics is available 48-96 hours after online publication and is updated daily on week days.
Initial download of the metrics may take a while.