Fig. 8.
Download original image
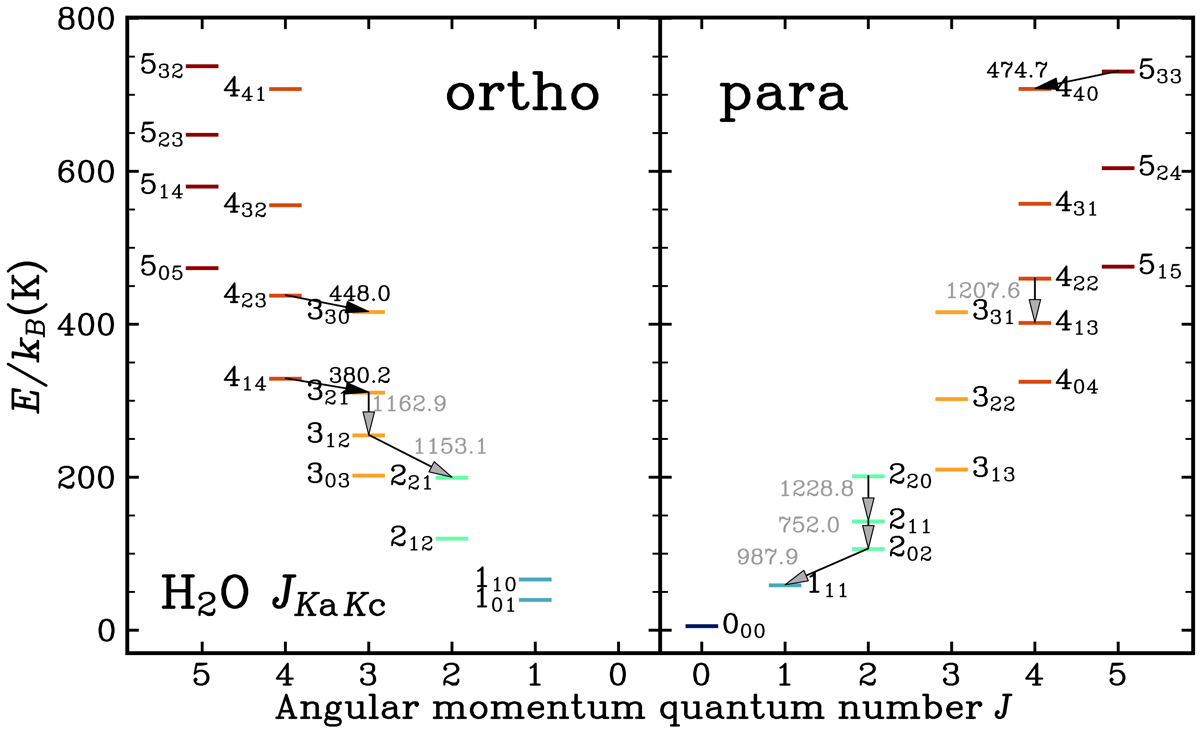
Energy diagram of an H2O molecule. Black lines indicate the H2O lines detected from our line survey, while gray lines indicate the observed water transitions from other works (see Table 5 for references), with their frequencies indicated (in GHz). The H2O data are taken from the JPL Molecular Spectroscopy website https://spec.jpl.nasa.gov.
Current usage metrics show cumulative count of Article Views (full-text article views including HTML views, PDF and ePub downloads, according to the available data) and Abstracts Views on Vision4Press platform.
Data correspond to usage on the plateform after 2015. The current usage metrics is available 48-96 hours after online publication and is updated daily on week days.
Initial download of the metrics may take a while.