Fig. 5.
Download original image
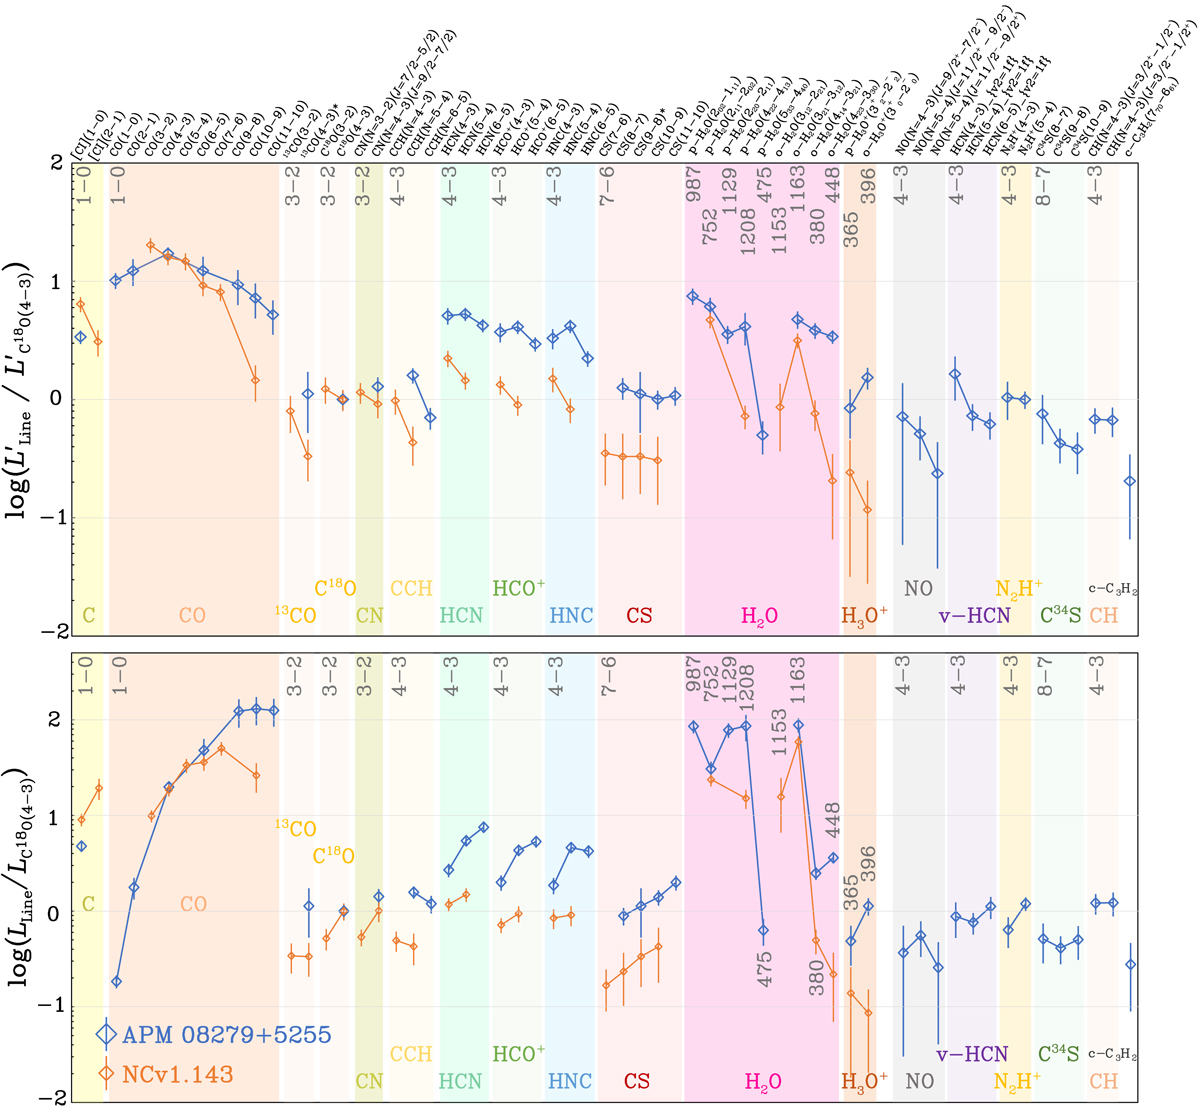
Line luminosities of APM 08279+5255 and NCv1.143 (based on the line fluxes listed in Table 5, where we also include several detections from the literature). Error bars are propagated from the measured flux errors. The upper panel shows the line luminosity in K km s−1 pc2, ![]() , normalized by the value of C18O(4–3). The lower panel shows the line luminosity in L⊙, Lline, normalized by the C18O(4–3) line. The lowest levels of the transitions of each molecule detected are labeled at the top of each panel, except for H2O and H3O+, where the rest-frame frequencies in GHz are given. Each transition is identified in the upper part of the figure. Compared with NCv1.143, the excitation condition is more extreme in APM 08279+5255 as seen from the SLEDs from several molecules.
, normalized by the value of C18O(4–3). The lower panel shows the line luminosity in L⊙, Lline, normalized by the C18O(4–3) line. The lowest levels of the transitions of each molecule detected are labeled at the top of each panel, except for H2O and H3O+, where the rest-frame frequencies in GHz are given. Each transition is identified in the upper part of the figure. Compared with NCv1.143, the excitation condition is more extreme in APM 08279+5255 as seen from the SLEDs from several molecules.
Current usage metrics show cumulative count of Article Views (full-text article views including HTML views, PDF and ePub downloads, according to the available data) and Abstracts Views on Vision4Press platform.
Data correspond to usage on the plateform after 2015. The current usage metrics is available 48-96 hours after online publication and is updated daily on week days.
Initial download of the metrics may take a while.