Fig. 4.
Download original image
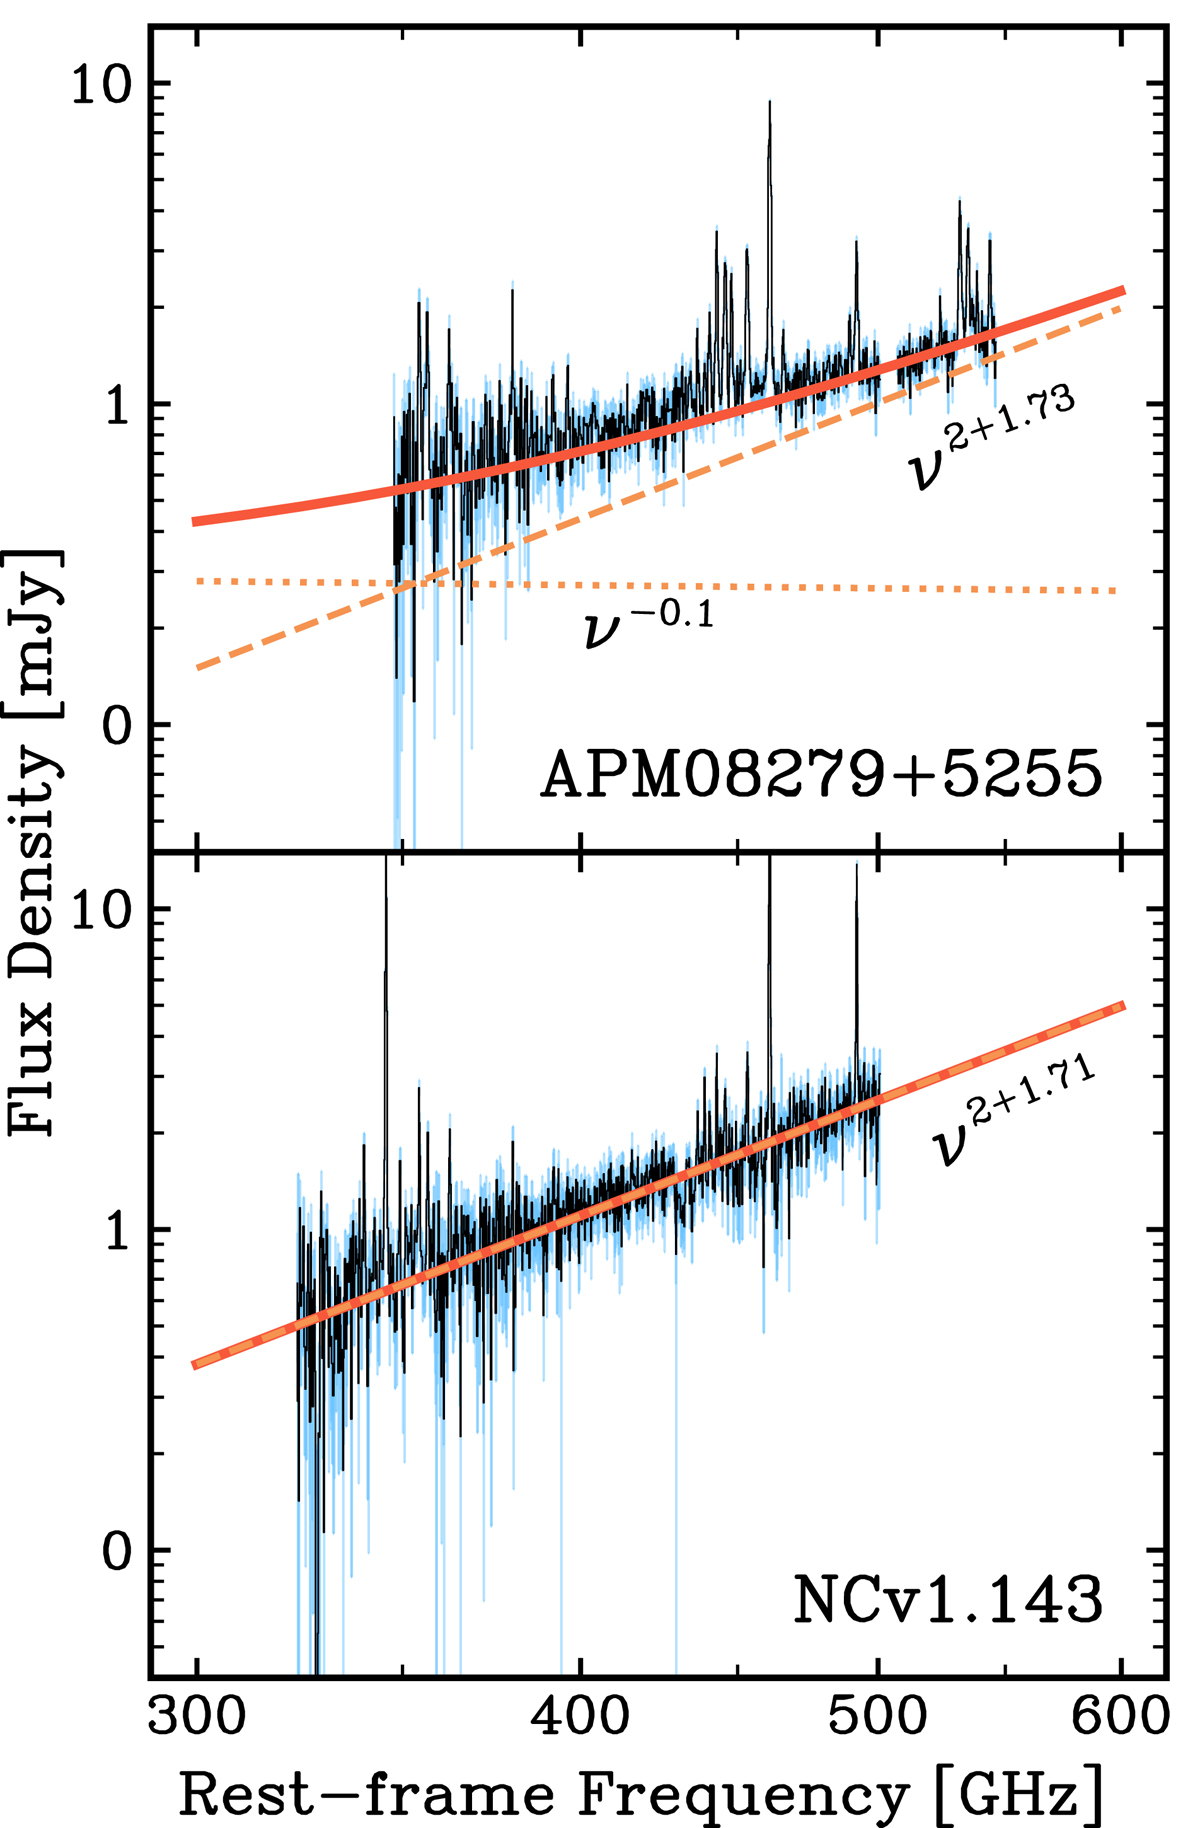
Fitting of the continuum of APM 08279+5255 and NCv1.143. Fluxes and errors are in black and blue, respectively. The solid red lines represent the total flux from the model. The dotted and dashed orange lines are the free-free and thermal dust components from the model, respectively. It is clear from the fitting that APM 08279+5255 has a flatter spectrum, which can be explained by contributions from free-free and/or corona emission from the SMBH, while the continuum of NCv1.143 is dominated by thermal dust.
Current usage metrics show cumulative count of Article Views (full-text article views including HTML views, PDF and ePub downloads, according to the available data) and Abstracts Views on Vision4Press platform.
Data correspond to usage on the plateform after 2015. The current usage metrics is available 48-96 hours after online publication and is updated daily on week days.
Initial download of the metrics may take a while.