Fig. 3.
Download original image
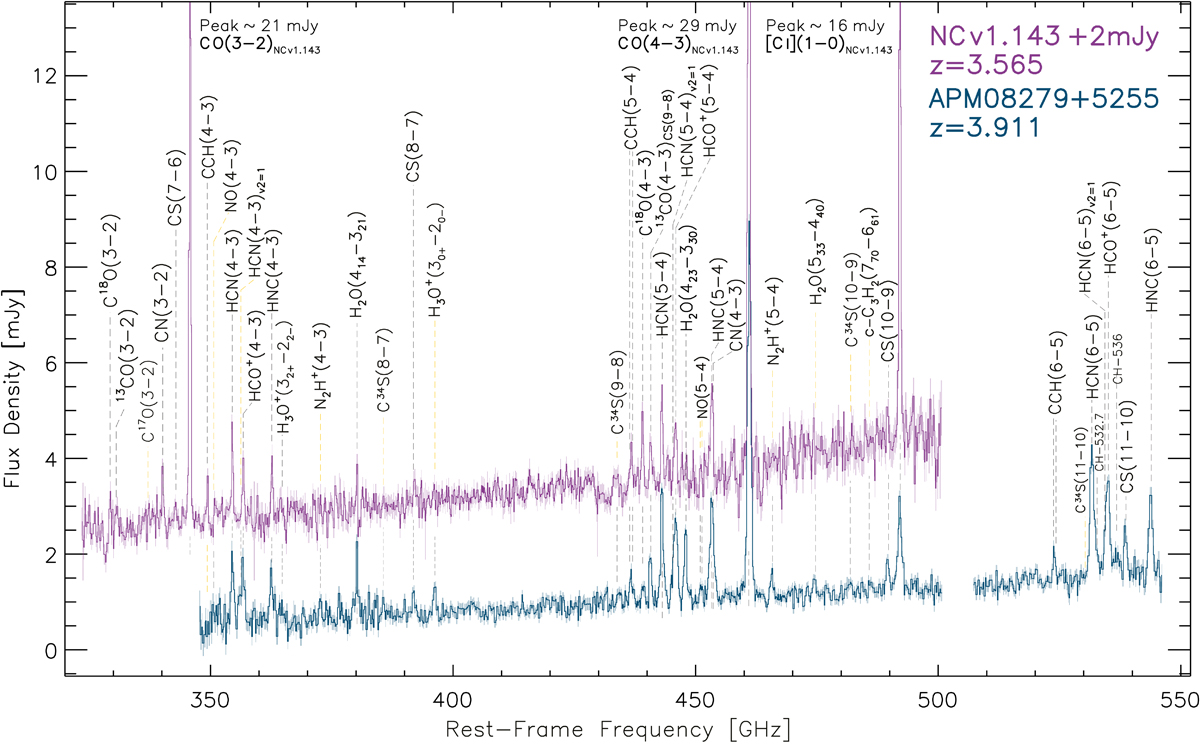
NOEMA 3 mm band spectral surveys of APM 08279+5255 and NCv1.143, shown as the blue and violet spectra, respectively. For visualization purposes, the spectrum of NCv1.143 has been shifted up by 2 mJy. Both spectra are binned to 50 MHz (about 150 km s−1) to highlight the line detection. Error bars are indicated by thin lines (the same color as the spectra) overlaid on the spectra. Dashed black lines identify the lines detected in both sources, while dashed orange lines highlight the lines that are only detected in one of the two sources. The line names are labeled above the dashed lines. The peak values indicated for CO(3 − 2), CO(4 − 3), and [C I](1-0) emission lines in NCv1.143 are the true peak values before the 2 mJy shift, and they are outside the box of the figure. A zoomed-in view is provided in Fig. A.1.
Current usage metrics show cumulative count of Article Views (full-text article views including HTML views, PDF and ePub downloads, according to the available data) and Abstracts Views on Vision4Press platform.
Data correspond to usage on the plateform after 2015. The current usage metrics is available 48-96 hours after online publication and is updated daily on week days.
Initial download of the metrics may take a while.