Fig. E.1.
Download original image
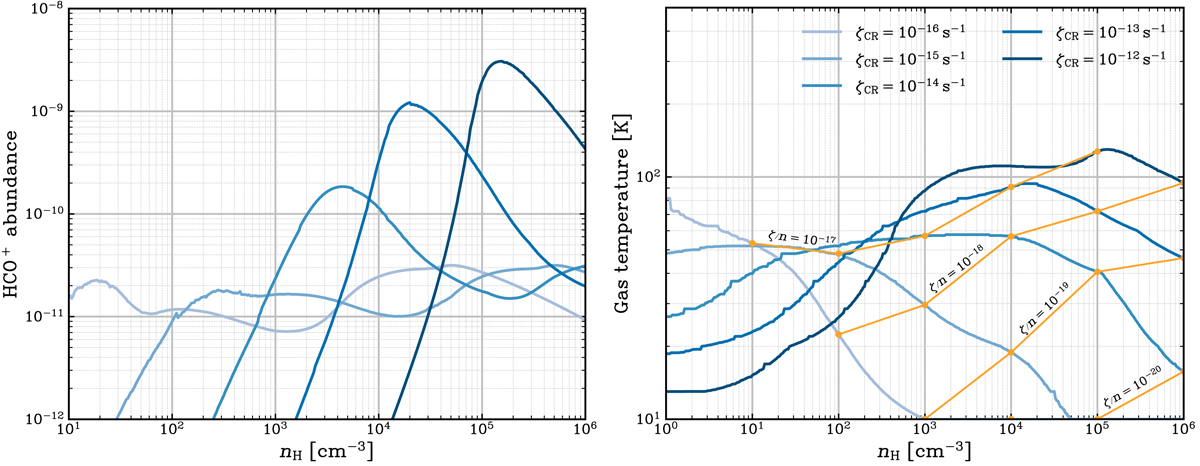
Chemical models for HCO+. Left panel: HCO+ abundance versus the local total H-nucleus number density, nH, for different CR ionization rates. In all cases, the abundance of HCO+ peaks for densities 8 × 10³ ≲ nH ≲ 3 × 105 cm−3. Right panel: Temperature profile, with the iso-(ζ/n) lines overplotted in orange, for different CR ionization rates (ζCR = 10−16 − 10−12 s−1, with the same color code as the left panel).
Current usage metrics show cumulative count of Article Views (full-text article views including HTML views, PDF and ePub downloads, according to the available data) and Abstracts Views on Vision4Press platform.
Data correspond to usage on the plateform after 2015. The current usage metrics is available 48-96 hours after online publication and is updated daily on week days.
Initial download of the metrics may take a while.