Fig. C.4.
Download original image
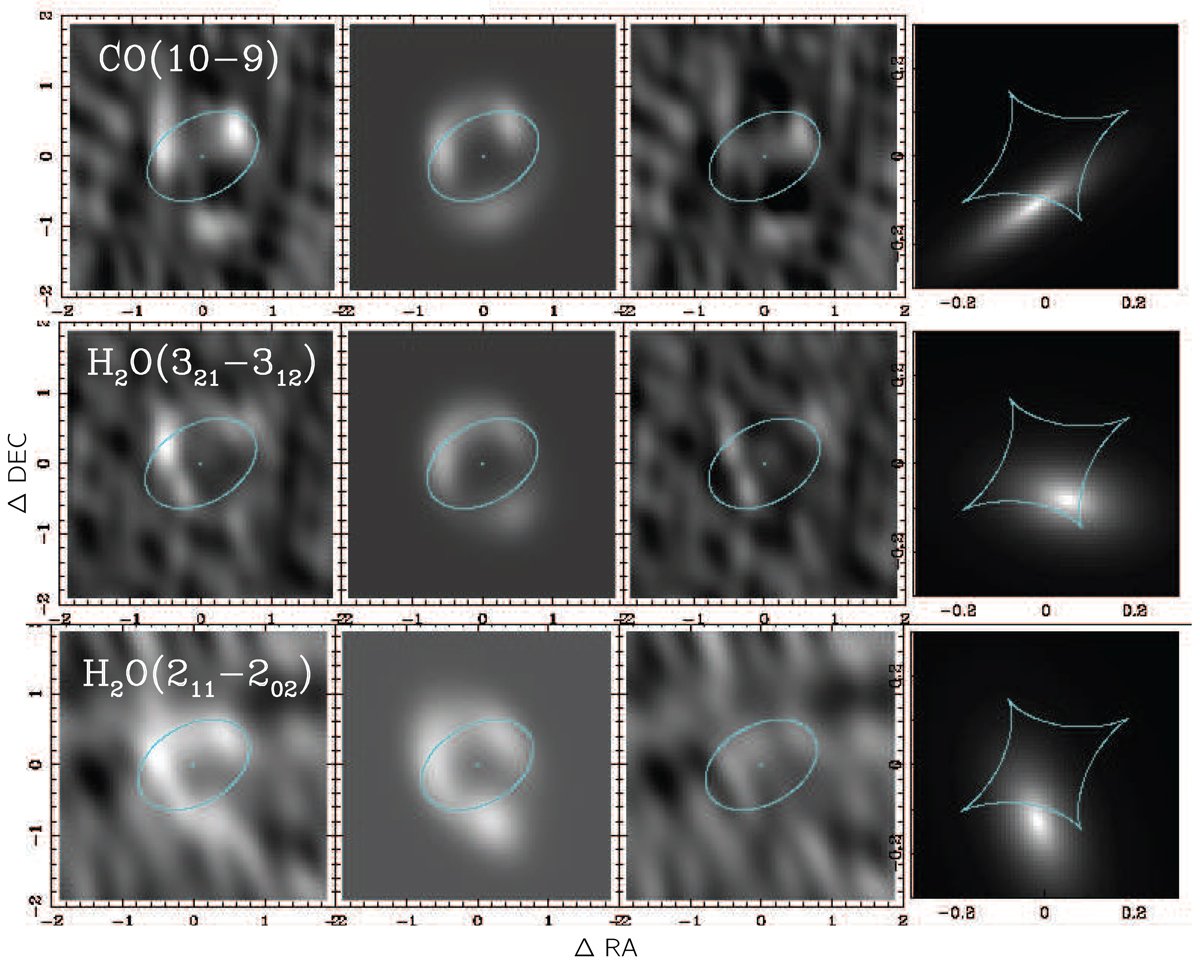
From top to bottom, each row: Lens model of the CO(10–9), H2O(321 − 312) and H2O(211 − 202) lines in NCv1.143. From left to right: (1) Observed CLEANed images of the emission line. (2) Model images with the model parameters of Table . (3) Residuals from the difference between observed and model images. (4) Reconstructed images of the emission line in the source plane. The critical curves and caustics are shown in cyan lines in the first three columns and the fourth column, respectively. The position of the deflector is indicated by the cyan points. One should note that the position of the background source in the source plane is not well-constrained. Thus, the differences seen in the positions of the three lines are not significant, considering the uncertainties.
Current usage metrics show cumulative count of Article Views (full-text article views including HTML views, PDF and ePub downloads, according to the available data) and Abstracts Views on Vision4Press platform.
Data correspond to usage on the plateform after 2015. The current usage metrics is available 48-96 hours after online publication and is updated daily on week days.
Initial download of the metrics may take a while.