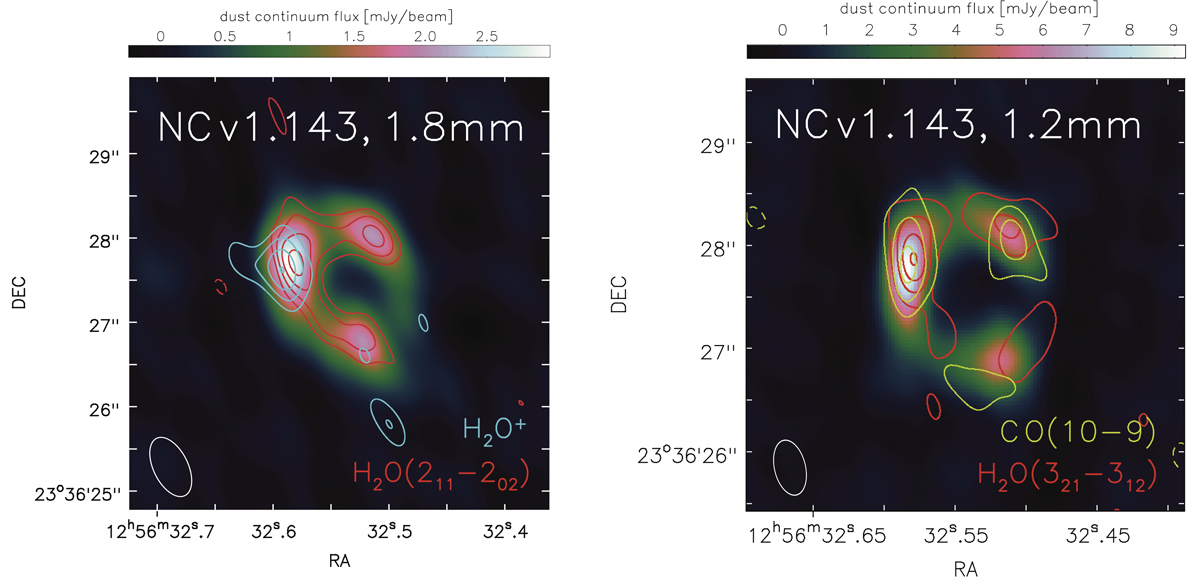
Fig. C.1.
Download original image
NOEMA images of NCv1.143. Color images are the ∼1.8 mm and ∼1.2 mm dust continuum. Yellow, red, and blue contours are the CO(10–9), H2O, and H2O+ lines. The synthesized beams are 0.76″×0.41″and 0.54″×0.30″for the 1.8 and 1.2 mm bands, respectively. The contour levels are: in steps of 1 σ started from ± 3 σ for the H2O(211 − 202) and the H2O+ lines; and in steps of 3 σ started from ± 3 σ for the H2O(321 − 312) and the CO(10–9) lines.
Current usage metrics show cumulative count of Article Views (full-text article views including HTML views, PDF and ePub downloads, according to the available data) and Abstracts Views on Vision4Press platform.
Data correspond to usage on the plateform after 2015. The current usage metrics is available 48-96 hours after online publication and is updated daily on week days.
Initial download of the metrics may take a while.