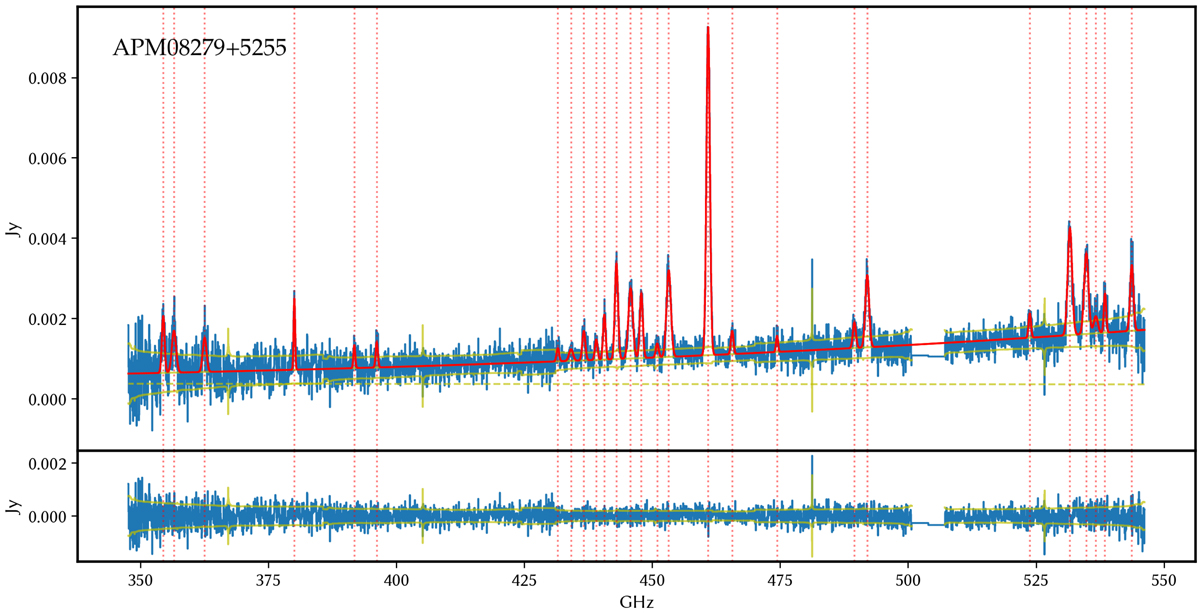
Fig. A.2.
Download original image
Fitting results of the spectra of APM 08279+5255, with the x-axis as the rest-frame frequency and the y-axis as the observed flux density. The top panel shows the observed spectrum in blue with the uncertainties in the green line. The red solid lines indicate the fit to the entire spectrum, and the dashed red lines are the position of the identified lines. The lower panel shows the residual.
Current usage metrics show cumulative count of Article Views (full-text article views including HTML views, PDF and ePub downloads, according to the available data) and Abstracts Views on Vision4Press platform.
Data correspond to usage on the plateform after 2015. The current usage metrics is available 48-96 hours after online publication and is updated daily on week days.
Initial download of the metrics may take a while.