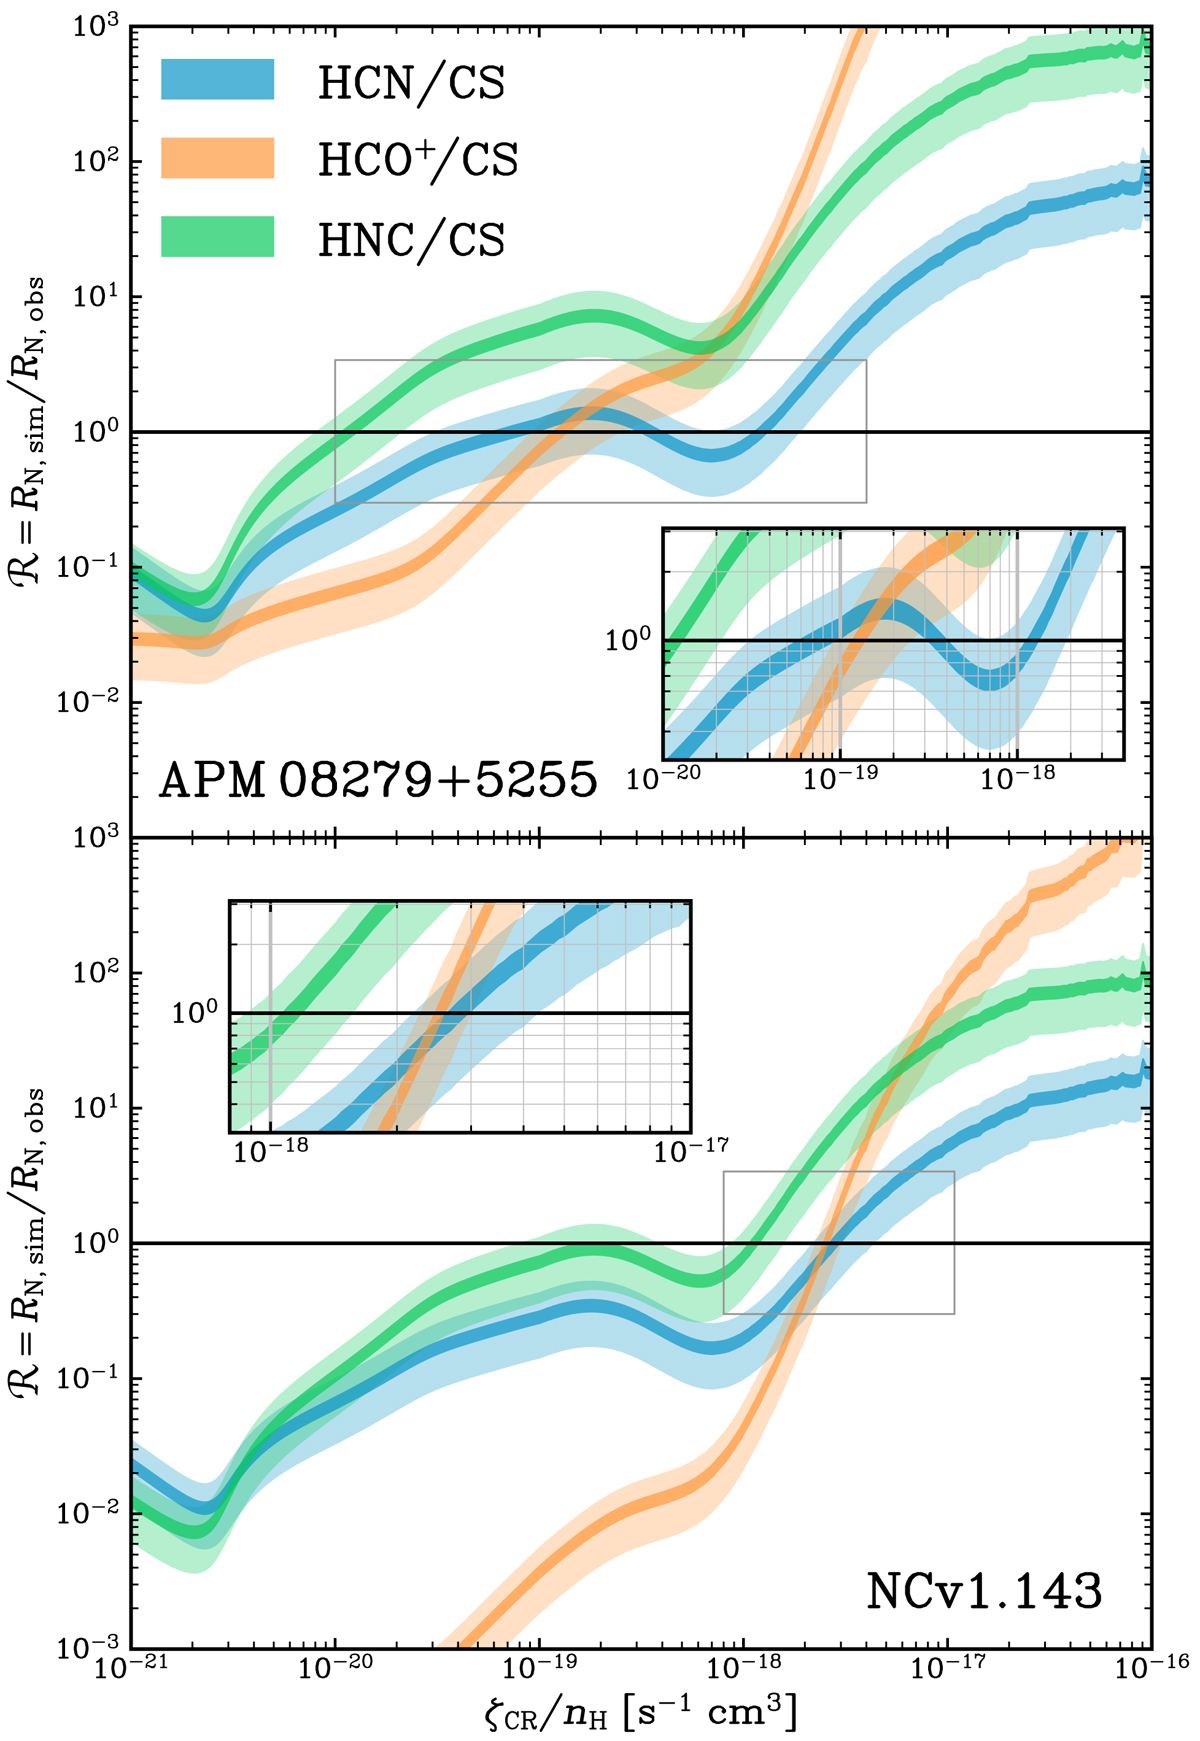
Fig. 14.
Download original image
Chemical modeling using 3D-DPR to identify the best range of the CR ionization parameter ζCR/nH (x-axis) based on the observed column density ratios. The column densities of HCN (blue), HCO+ (orange), and HNC (green) are normalized with CS. The y-axis shows the ratio of the modeled column density ratio to the observed one. Unity marks agreement between the models and observations. The upper panel shows the results for APM 08279+5255, and the lower panel shows those for NCv1.143. The insets are zoom-in regions of the gray rectangular area in each panel. The thickness of each line represents the uncertainty (light color is for 50% uncertainty, and dark color is for 10% uncertainty).
Current usage metrics show cumulative count of Article Views (full-text article views including HTML views, PDF and ePub downloads, according to the available data) and Abstracts Views on Vision4Press platform.
Data correspond to usage on the plateform after 2015. The current usage metrics is available 48-96 hours after online publication and is updated daily on week days.
Initial download of the metrics may take a while.