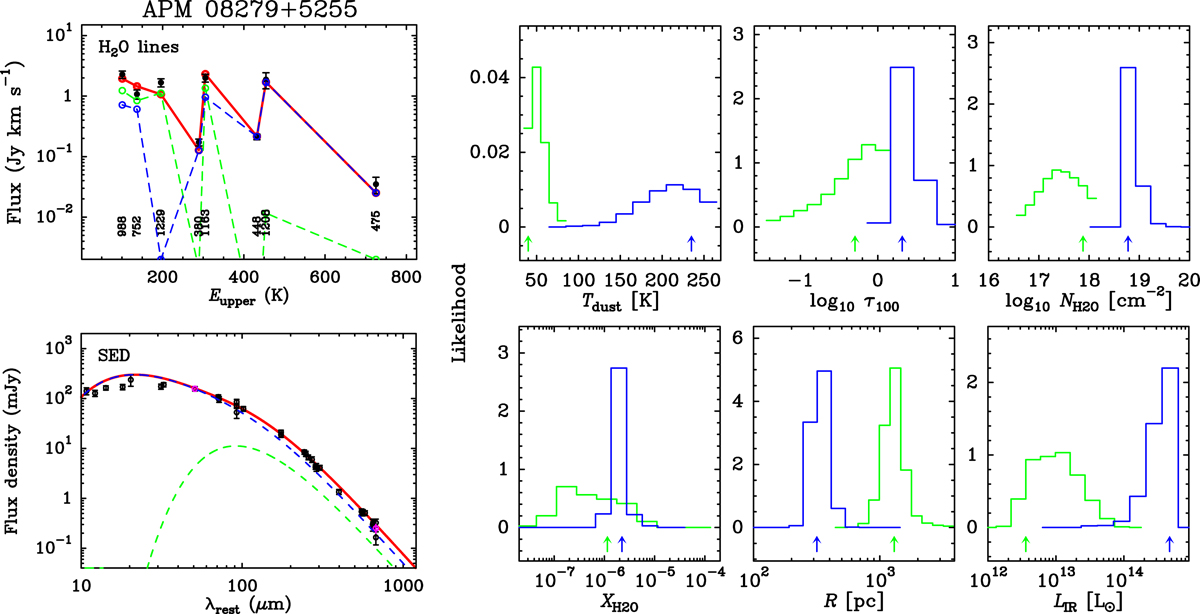
Fig. 10.
Download original image
Best-fit model and the likelihood of the parameters from the model of the H2O lines and the dust continuum in APM 08279+5255. Top left: Observed lensing-corrected (black data points) versus modeled H2O integrated flux (green and blue are the extended and compact components, respectively; red is the total). Bottom-left: Lensing-corrected modeled dust SED from the two components (same colors as in the top panel). The photometric data are taken from Leung et al. (2019). Right panels: Likelihood distributions of the key parameters of the H2O model, with the same colors as in the left panels. The arrows indicate the maximum likelihood values (Table 6).
Current usage metrics show cumulative count of Article Views (full-text article views including HTML views, PDF and ePub downloads, according to the available data) and Abstracts Views on Vision4Press platform.
Data correspond to usage on the plateform after 2015. The current usage metrics is available 48-96 hours after online publication and is updated daily on week days.
Initial download of the metrics may take a while.