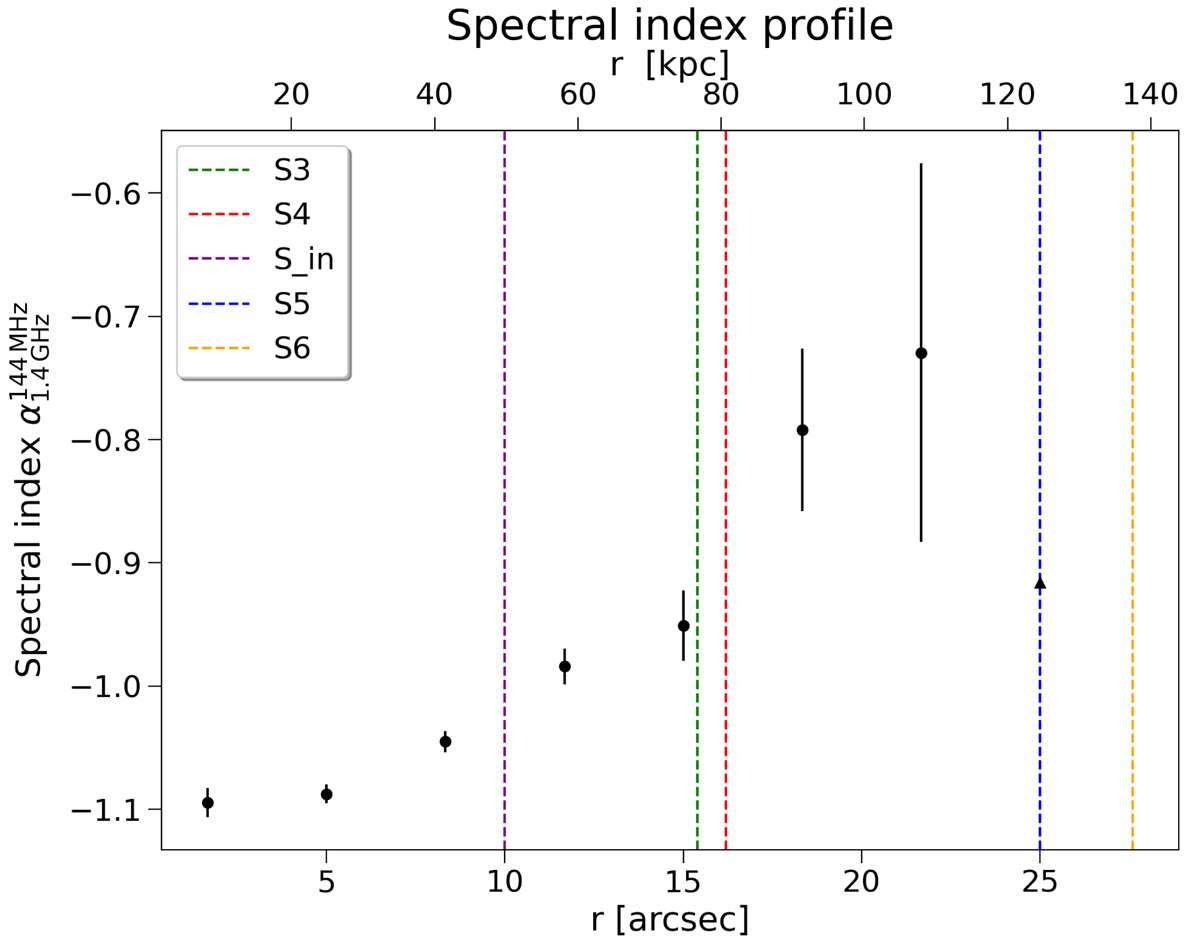
Fig. 4.
Download original image
Spectral index trend of the mini halo between 144 MHz and 1.425 GHz versus the distance from the cluster centre, assumed to be coincident with the AGN brightness peak in the LOFAR and VLA images, separately. Errorbars refer to statistical errors only. Vertical lines indicate the position of the shock fronts detected by Ubertosi et al. (2023).
Current usage metrics show cumulative count of Article Views (full-text article views including HTML views, PDF and ePub downloads, according to the available data) and Abstracts Views on Vision4Press platform.
Data correspond to usage on the plateform after 2015. The current usage metrics is available 48-96 hours after online publication and is updated daily on week days.
Initial download of the metrics may take a while.