Fig. 3.
Download original image
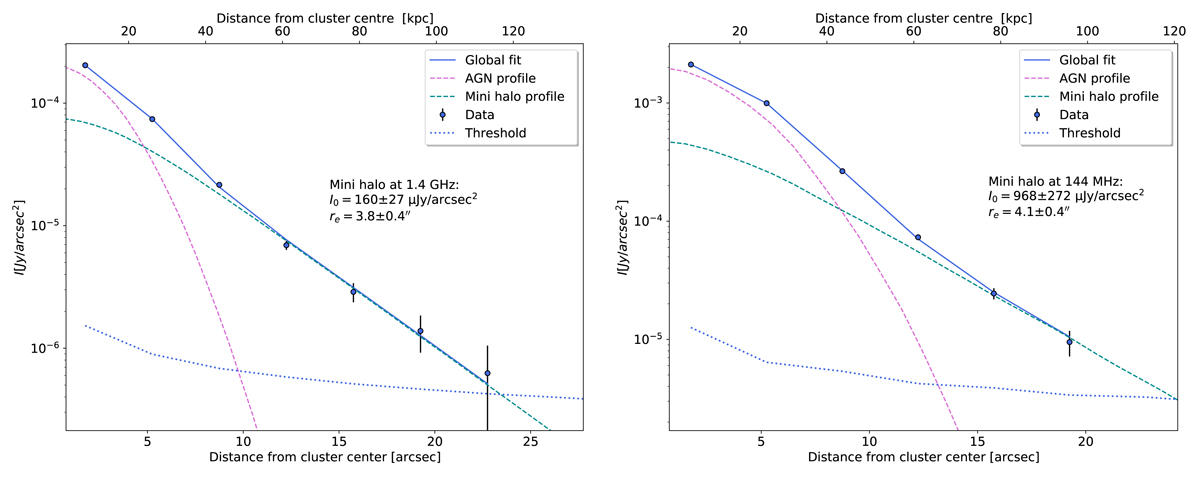
Exponential plus Gaussian fit of the emission from RBS 797 (Eq. (1)) for VLA (left) and LOFAR (right) images. The blue solid line refers to the total best fit (mini halo plus AGN emission). Points refer to the mean brightness per square arcsec observed in each annulus, and the dotted blue line shows the thresholds we have considered (![]() , with Nbeams being the number of beams sampled in each annulus). The green line refers to the exponential mini halo fitted profile, the purple line to the gaussian AGN fitted profile. Best-fit parameters are listed in Table 4.
, with Nbeams being the number of beams sampled in each annulus). The green line refers to the exponential mini halo fitted profile, the purple line to the gaussian AGN fitted profile. Best-fit parameters are listed in Table 4.
Current usage metrics show cumulative count of Article Views (full-text article views including HTML views, PDF and ePub downloads, according to the available data) and Abstracts Views on Vision4Press platform.
Data correspond to usage on the plateform after 2015. The current usage metrics is available 48-96 hours after online publication and is updated daily on week days.
Initial download of the metrics may take a while.