Fig. 2.
Download original image
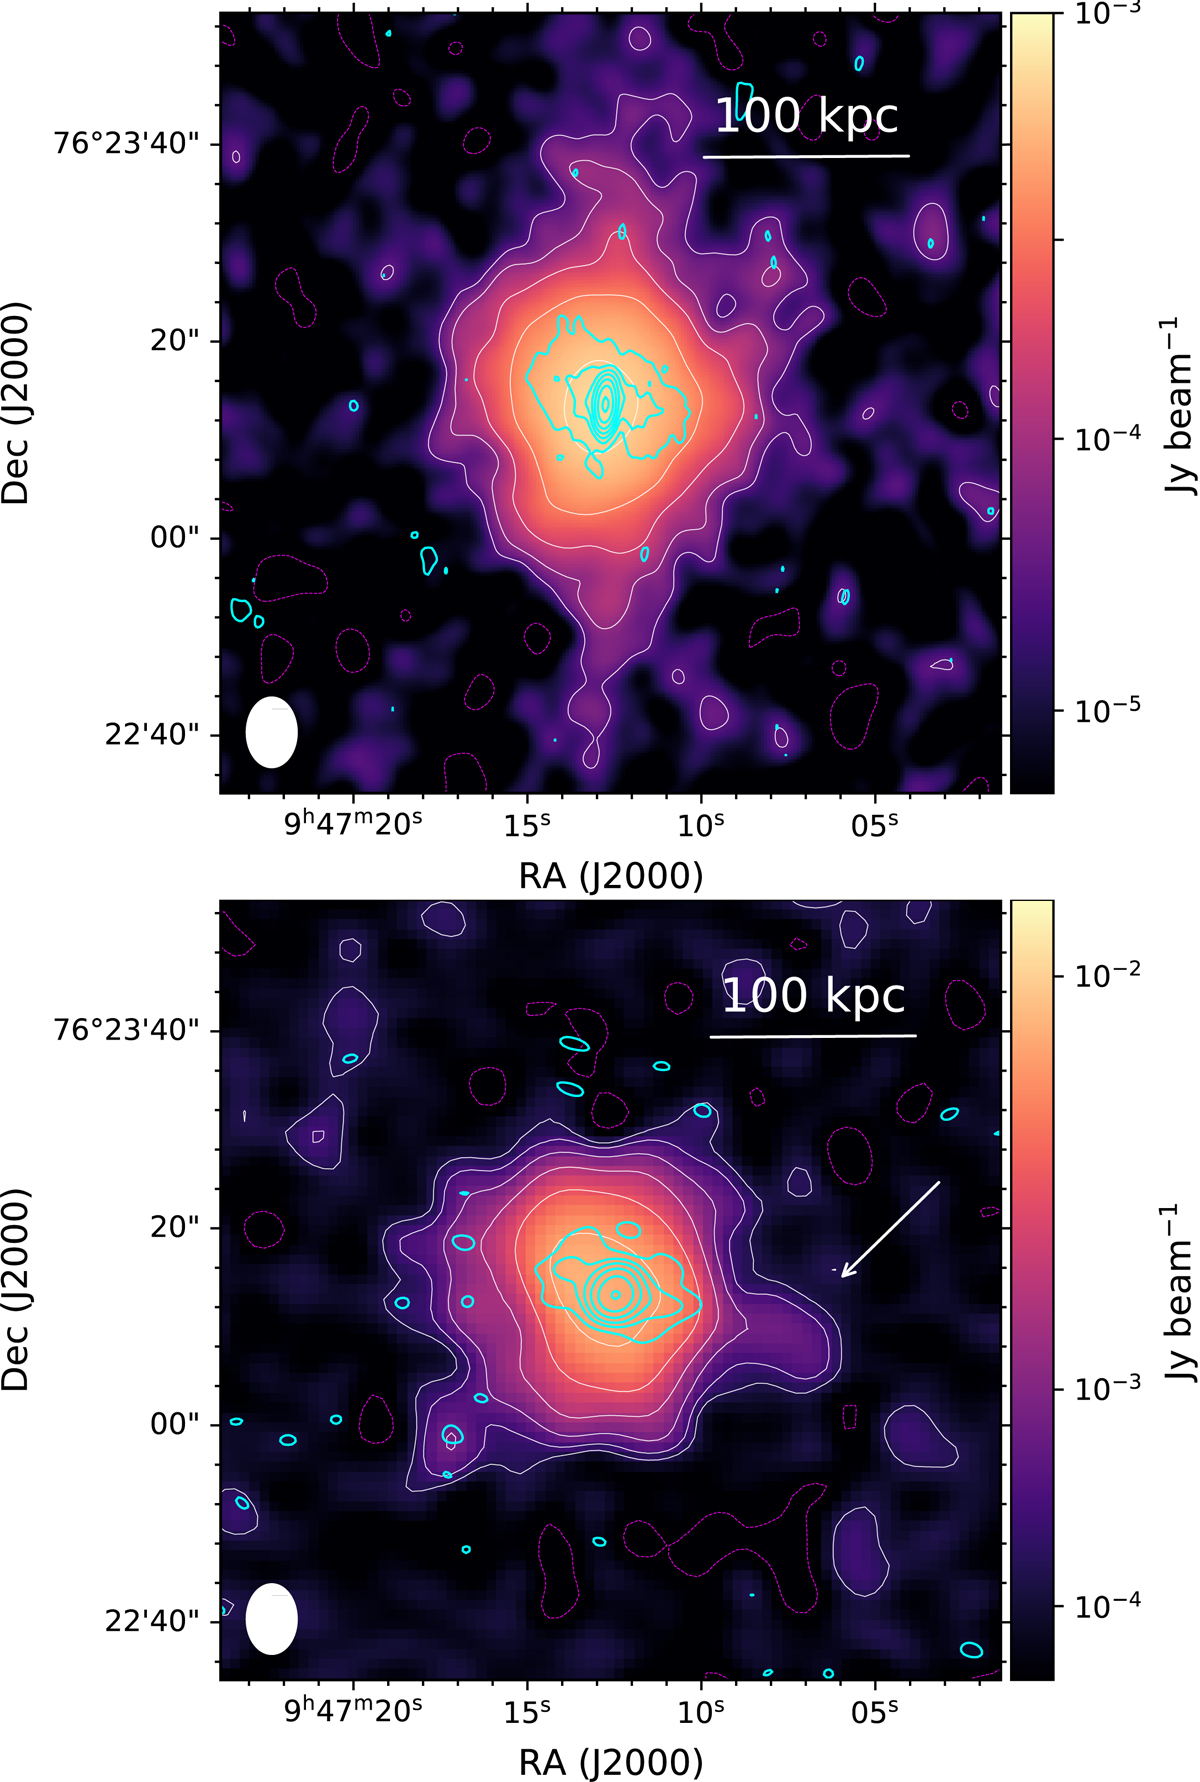
Cluster RBS 797 at LOFAR and VLA frequencies. Top panel: VLA image at 1.425 GHz of the cluster RBS 797. Colours, white, and magenta contours refer to the image at resolution of 7″ × 5″ obtained after the subtraction of the central sources. The noise is σrms = 0.02 mJy beam−1. White contours start at 2σrms and increase by a factor 2 each. The −3σrms contour is displayed in magenta. Cyan contours refer to the image of the central source obtained imposing an inner UV-cut of 104λ and start at 3σrms = 0.02 mJy beam−1, where the beam is 2.4″ × 1.2″. Cyan contours increase by a factor 2. Bottom panel: LOFAR HBA image at 144 MHz of the cluster RBS 797. Colours, white, and magenta contours refer to the image at resolution of 7″ × 5″ obtained after the subtraction of the central sources. The noise is σrms = 0.1 mJy beam−1. White contours start at 2σrms and increase by a factor 2 each. The −3σrms contour is displayed in magenta. Cyan contours refer to the image of the central source, obtained imposing an inner UV-cut of 8 × 10³λ and start at 3σrms = 0.3 mJy beam−1, where the beam is 3.1″ × 2.1″. Cyan contours increase by a factor 2. The white arrow indicates the new western plume discovered with LOFAR.
Current usage metrics show cumulative count of Article Views (full-text article views including HTML views, PDF and ePub downloads, according to the available data) and Abstracts Views on Vision4Press platform.
Data correspond to usage on the plateform after 2015. The current usage metrics is available 48-96 hours after online publication and is updated daily on week days.
Initial download of the metrics may take a while.