Fig. 8
Download original image
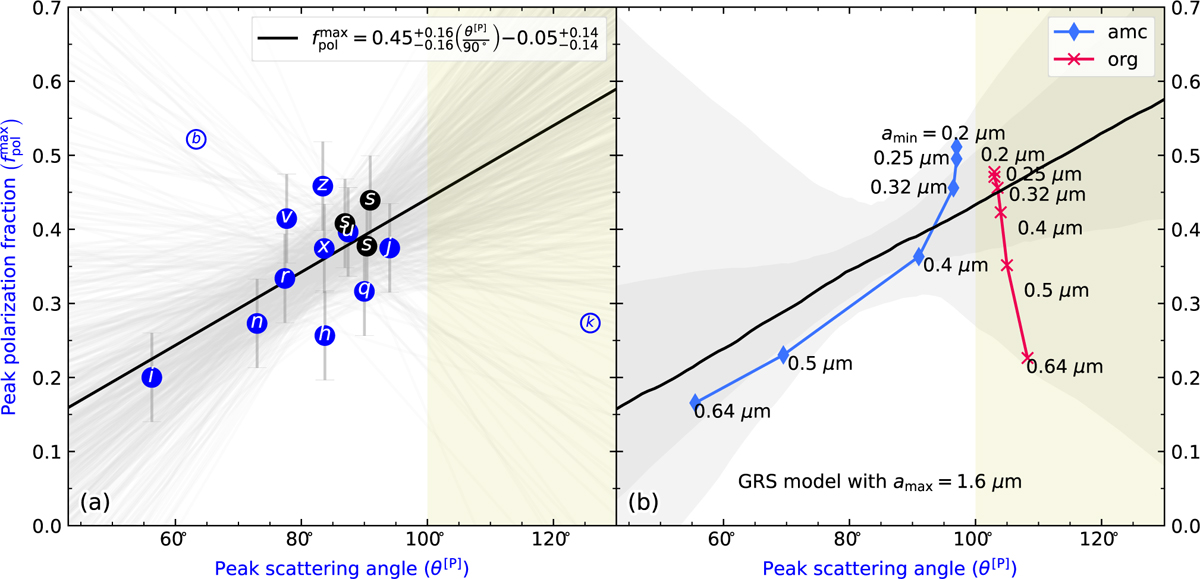
Scattering peak values in angle and fraction (SPAF) plot. (a) Tentative correlation between peak polarization fraction value and peak scattering angle, with the gray lines randomly fitting 6 to 12 systems for correlation exploration. The best-fit expression is performed on all data points here with a 0.06 uncertainty for the peak polarization fraction, and certain systems (For b or CQ Tau and k or HD 100546, marked with hollow symbols; for l or HD 143006, a scaled beta distribution cannot describe its polarization fraction curve, potentially due to large scale shadowing in Benisty et al. 2018.) were excluded from Fig. 7 to illustrate this relationship (see Sect. 5.2.1 for a detailed discussion). (b) Gaussian random sphere (GRS) dust models from Tazaki & Dominik (2022) and Tazaki et al. (2023) by varying the minimum dust size for irregular compact grains, overlaid on the 1σ and 2σ ranges from the resampling results in (a). We observe a similar trend for absorptive material (“amc”) but not for less absorptive materials (“org”), with the latter neither providing peak scattering angles with the observations that are consistent beyond ~100° (see Sect. 5.2.2). We note that the dust models do not necessarily reproduce the polarization fraction curves in Fig. 7.
Current usage metrics show cumulative count of Article Views (full-text article views including HTML views, PDF and ePub downloads, according to the available data) and Abstracts Views on Vision4Press platform.
Data correspond to usage on the plateform after 2015. The current usage metrics is available 48-96 hours after online publication and is updated daily on week days.
Initial download of the metrics may take a while.