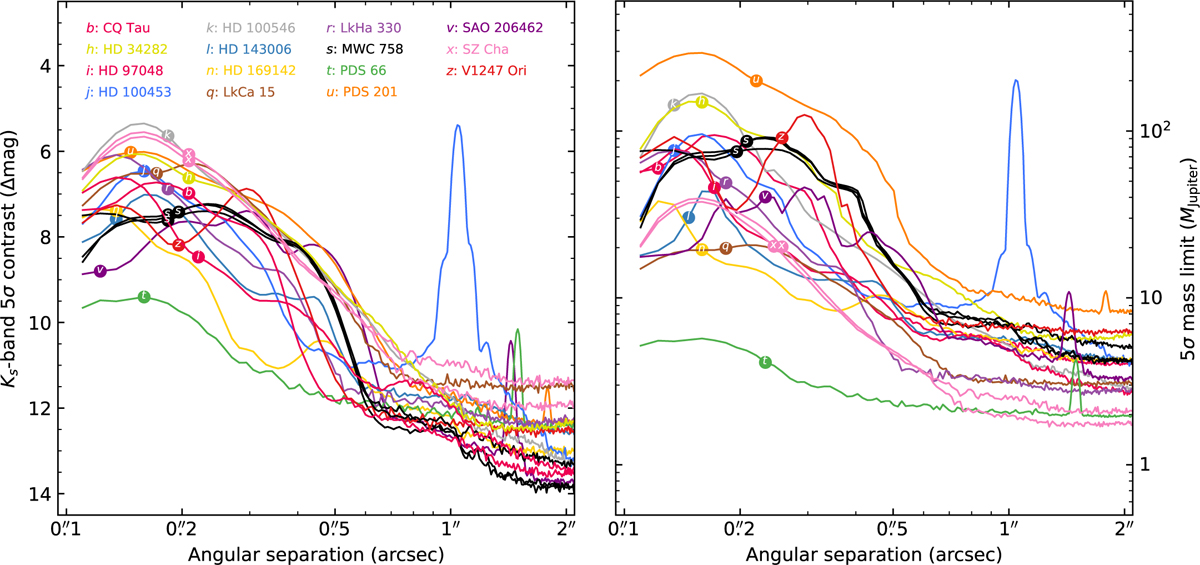
Fig. 5

Download original image
RDI contrast curves (left) and AMES-Cond mass limits (right) of DI-sNMF reductions for systems in Fig. 2 (see Sect. 4 for the detailed calculation procedure). Within ~0″.2, the measured contrast is prone to transmission reduction near the coronagraphic edge. The contrast peak at −1″ for j (HD 100453) is the binary companion. The contrast curve for t (PDS 66) is the deepest due to the faintness of the disk. The data used to create this figure are available at the CDS.
Current usage metrics show cumulative count of Article Views (full-text article views including HTML views, PDF and ePub downloads, according to the available data) and Abstracts Views on Vision4Press platform.
Data correspond to usage on the plateform after 2015. The current usage metrics is available 48-96 hours after online publication and is updated daily on week days.
Initial download of the metrics may take a while.


