Fig. E.1
Download original image
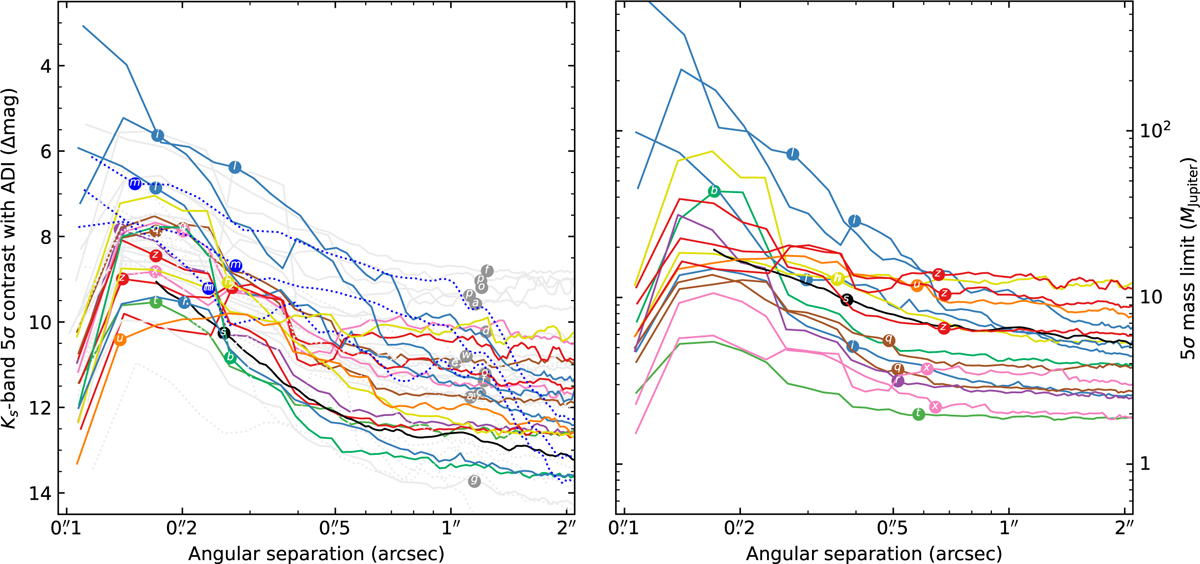
ADI contrast curves obtained from High Contrast Data Centre (left) and AMES-cond mass limits (right) for systems in this study, the line colors are consistent with Fig. 5. Disk hosts with only PDI detections (or marginal PDI detections) are displayed with light gray color with solid lines, and annotated with gray symbol; reference stars are in dotted light gray lines. For HD 163296, the ADI contrast curves are displayed and annotated in blue. The data used to create this figure are available at the CDS.
Current usage metrics show cumulative count of Article Views (full-text article views including HTML views, PDF and ePub downloads, according to the available data) and Abstracts Views on Vision4Press platform.
Data correspond to usage on the plateform after 2015. The current usage metrics is available 48-96 hours after online publication and is updated daily on week days.
Initial download of the metrics may take a while.