Fig. C.2
Download original image
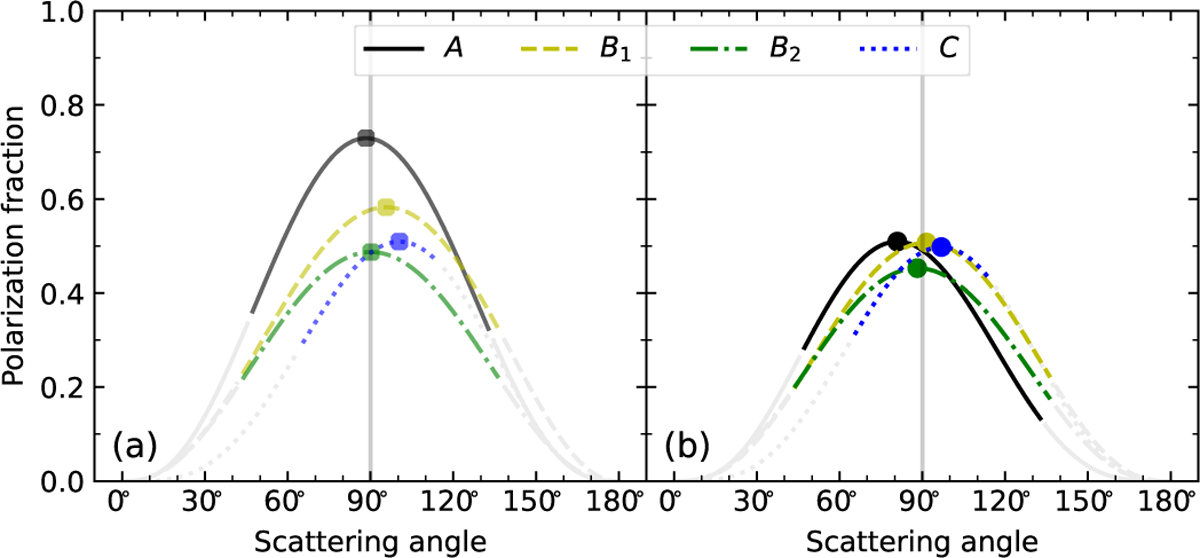
Best-fit polarization curves assuming beta distribution from RDI KLIP forward modeling in Figure C.1, the peak polarization locations are marked with circles. The light gray curves denote scattering angle ranges that are not accessible for inclined thin disks with no flaring. (a) Direct conversion: the extracted profiles are different even for the same system (i.e., B1 and B2). (b) Conversion with Savitzky-Golay filtered Qϕ data: the extracted curves are less distinct, since such reductions are less prone to pixel-wise discrete noise.
Current usage metrics show cumulative count of Article Views (full-text article views including HTML views, PDF and ePub downloads, according to the available data) and Abstracts Views on Vision4Press platform.
Data correspond to usage on the plateform after 2015. The current usage metrics is available 48-96 hours after online publication and is updated daily on week days.
Initial download of the metrics may take a while.