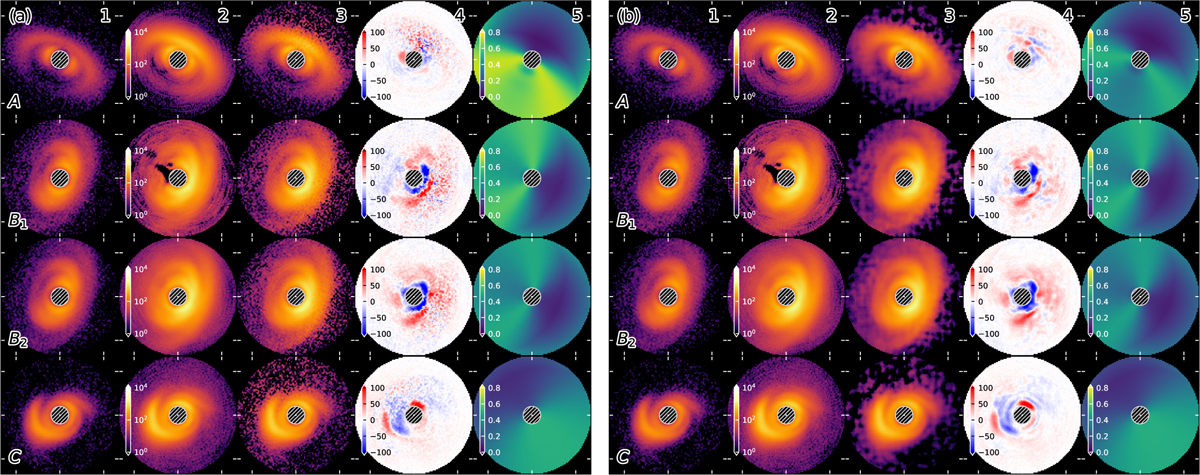
Fig. C.1
Download original image
Qϕ to total intensity conversion using polarization fraction with scaled beta distribution, (a): direct polarization map division, (b): Savitzky–Golay filtered Qϕ data. From top to bottom, A: LkCa 15, on 2020 December 8; B1: SZ Cha, on 2020 December 29; B2: SZ Cha, on 2020 December 30; C: V1247 Ori, on 2020 December 24. From left to right, 1: Qϕ data; 2: total intensity data from data imputation; 3: total intensity data converted from Qϕ data using polarization fraction maps; 4: RDI KLIP residuals using total intensity models; 5: polarization maps used to model total intensity data with RDI KLIP. A comparison between (a) and (b) shows an improvement of retrieving quality with the Savitzky–Golay filter. Nevertheless, the patterned residuals show that a single profile is limited in describing polarization fraction maps, especially when multiple disk components exist: modeling for separate disk components (e.g., rings in LkCa 15 and SZ Cha) is needed for authentic description of polarization fraction curves.
Current usage metrics show cumulative count of Article Views (full-text article views including HTML views, PDF and ePub downloads, according to the available data) and Abstracts Views on Vision4Press platform.
Data correspond to usage on the plateform after 2015. The current usage metrics is available 48-96 hours after online publication and is updated daily on week days.
Initial download of the metrics may take a while.