Open Access
Fig. 1
Download original image
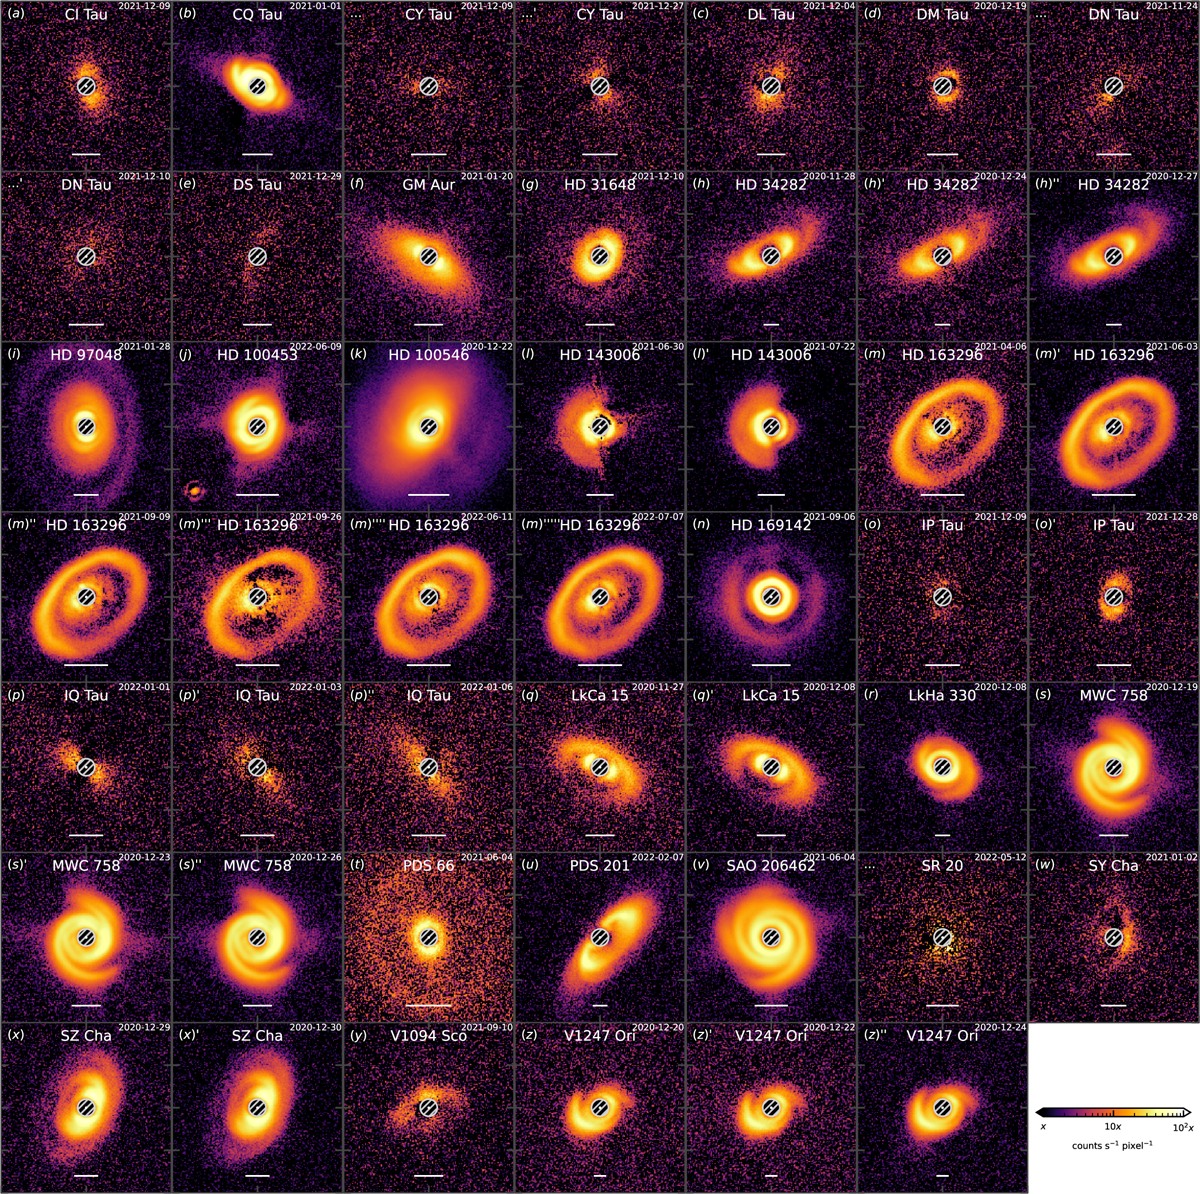
Ks-band Qϕ maps with dimensions of 2″ × 2″ with different color bars in log scale. The letter identifiers are from Table 1. The rulers correspond to 50 au. The regions interior to 0”. 1 are not accessible with coronagraph usage. We note that the data used to create this figure are available at the CDS.
Current usage metrics show cumulative count of Article Views (full-text article views including HTML views, PDF and ePub downloads, according to the available data) and Abstracts Views on Vision4Press platform.
Data correspond to usage on the plateform after 2015. The current usage metrics is available 48-96 hours after online publication and is updated daily on week days.
Initial download of the metrics may take a while.