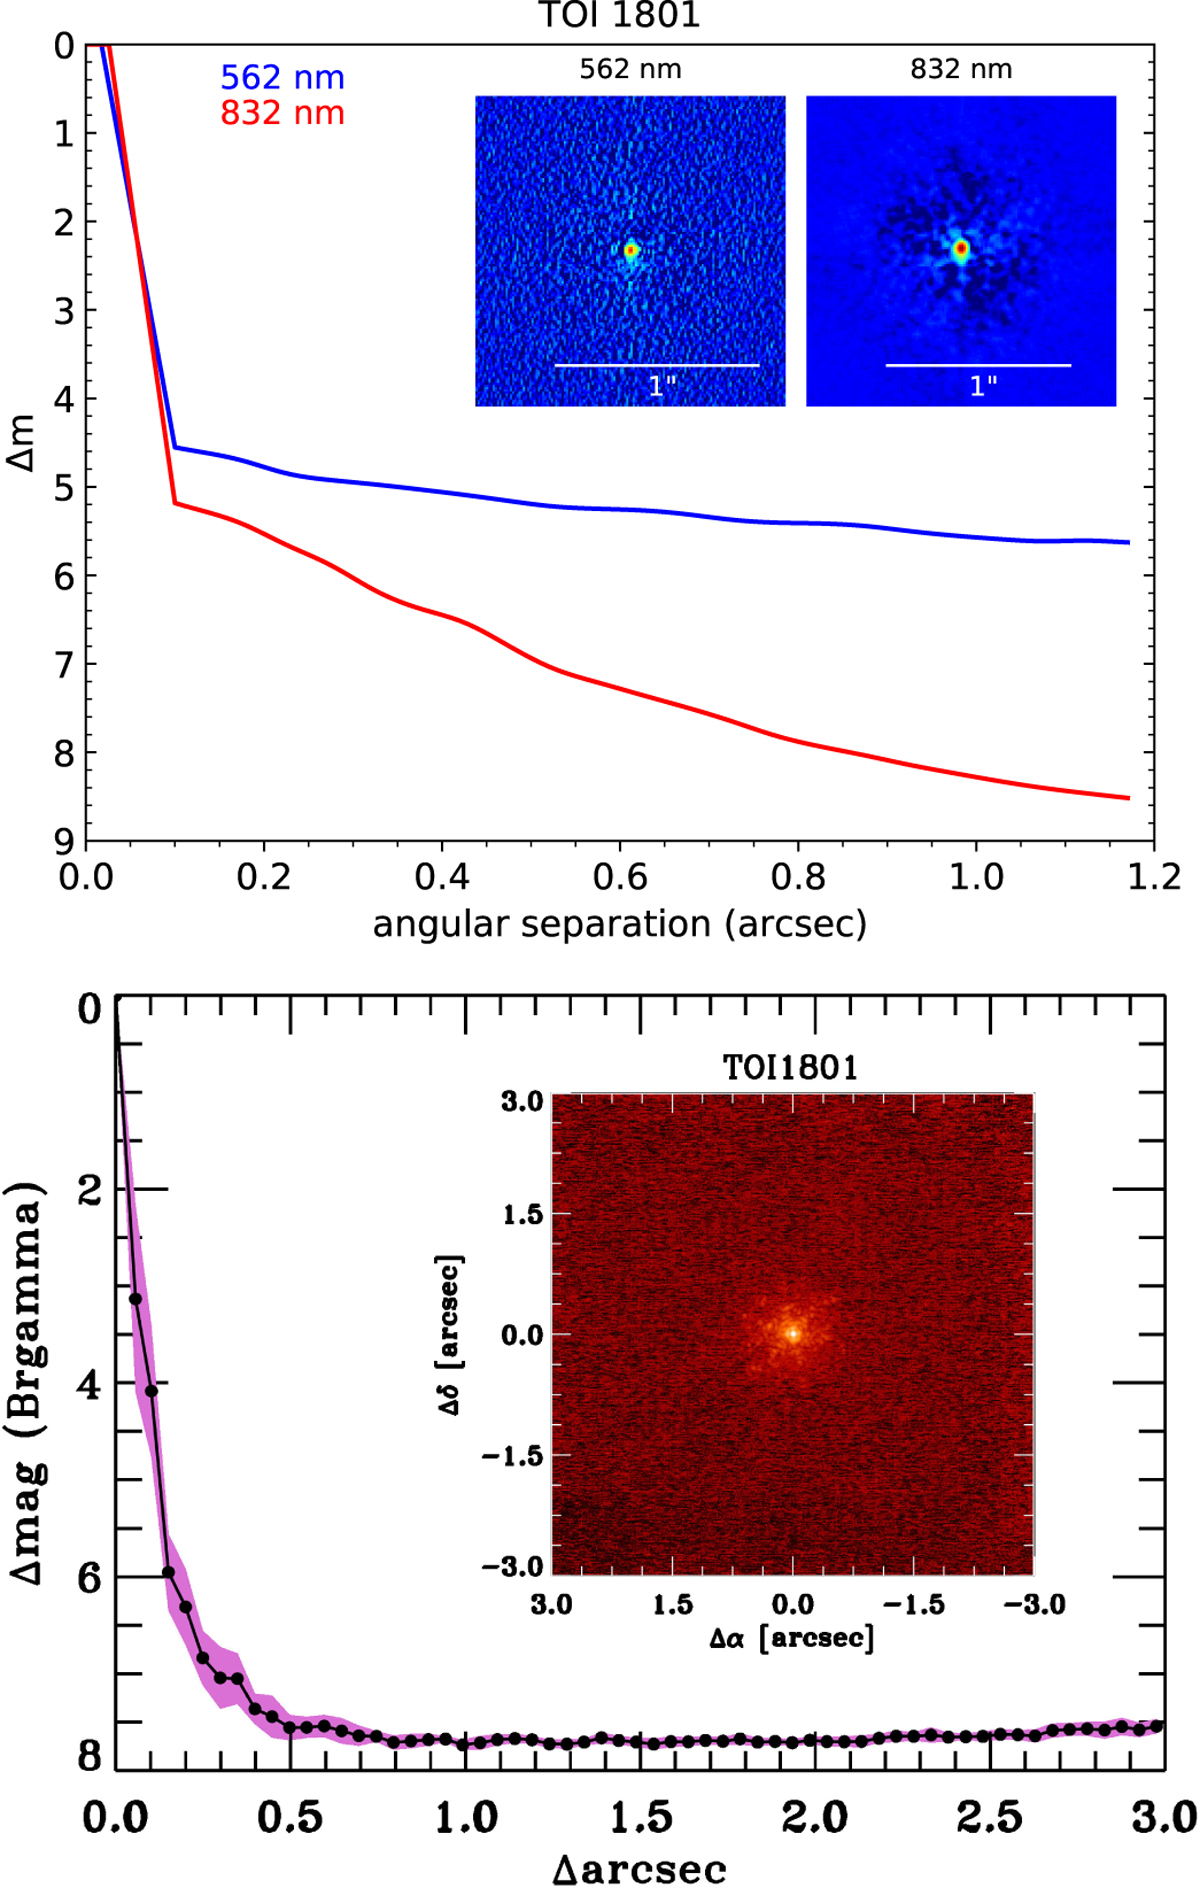
Fig. 3
Download original image
Contrast curves for TOI-1801 from ’Alopeke speckle imaging (top) and from the NIRC2 instrument (bottom). The blue, red, and black lines correspond to the filters of 562 nm, 832 nm, and 2.1686 μm, respectively. The insets show the reconstructed 1.25 × 1.25″2 for ’Alopeke speckle imaging and 6.0 × 6.0″2 for the NIRC2 instrument for each of filters. None of them reveals a close companion within 0.1″ down to Δ = 4–5 mag with respect to the target.
Current usage metrics show cumulative count of Article Views (full-text article views including HTML views, PDF and ePub downloads, according to the available data) and Abstracts Views on Vision4Press platform.
Data correspond to usage on the plateform after 2015. The current usage metrics is available 48-96 hours after online publication and is updated daily on week days.
Initial download of the metrics may take a while.