Fig. 2
Download original image
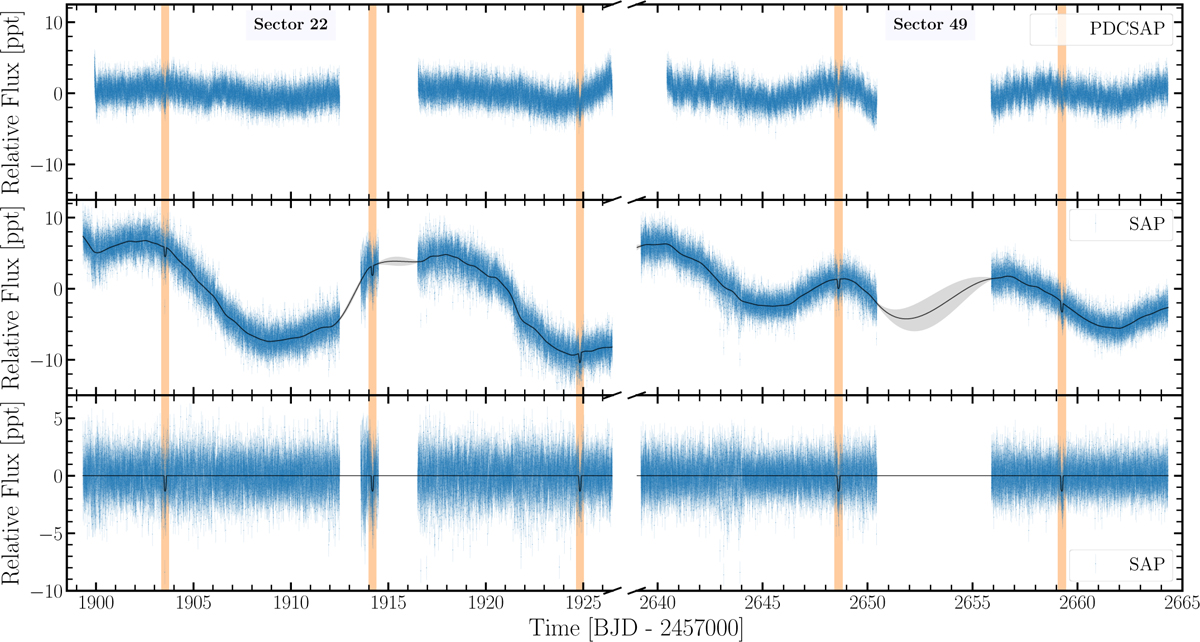
TESS light curves of TOI-1801 (sectors 22 and 49, blue dots). The vertical orange lines indicate the location of the planetary transits of TOI-1801 b. Top panel: SPOC PDCSAP fluxes. Middle panel: SPOC SAP fluxes; the black curve stands for the stellar activity plus planet transit model, the model 1σ uncertainty is shown by the grey shaded region. Bottom panel: detrended SAP light curve; the black line shows the best fit from a transit-only model. All photometric data points are plotted together with their error bars.
Current usage metrics show cumulative count of Article Views (full-text article views including HTML views, PDF and ePub downloads, according to the available data) and Abstracts Views on Vision4Press platform.
Data correspond to usage on the plateform after 2015. The current usage metrics is available 48-96 hours after online publication and is updated daily on week days.
Initial download of the metrics may take a while.