Fig. 17
Download original image
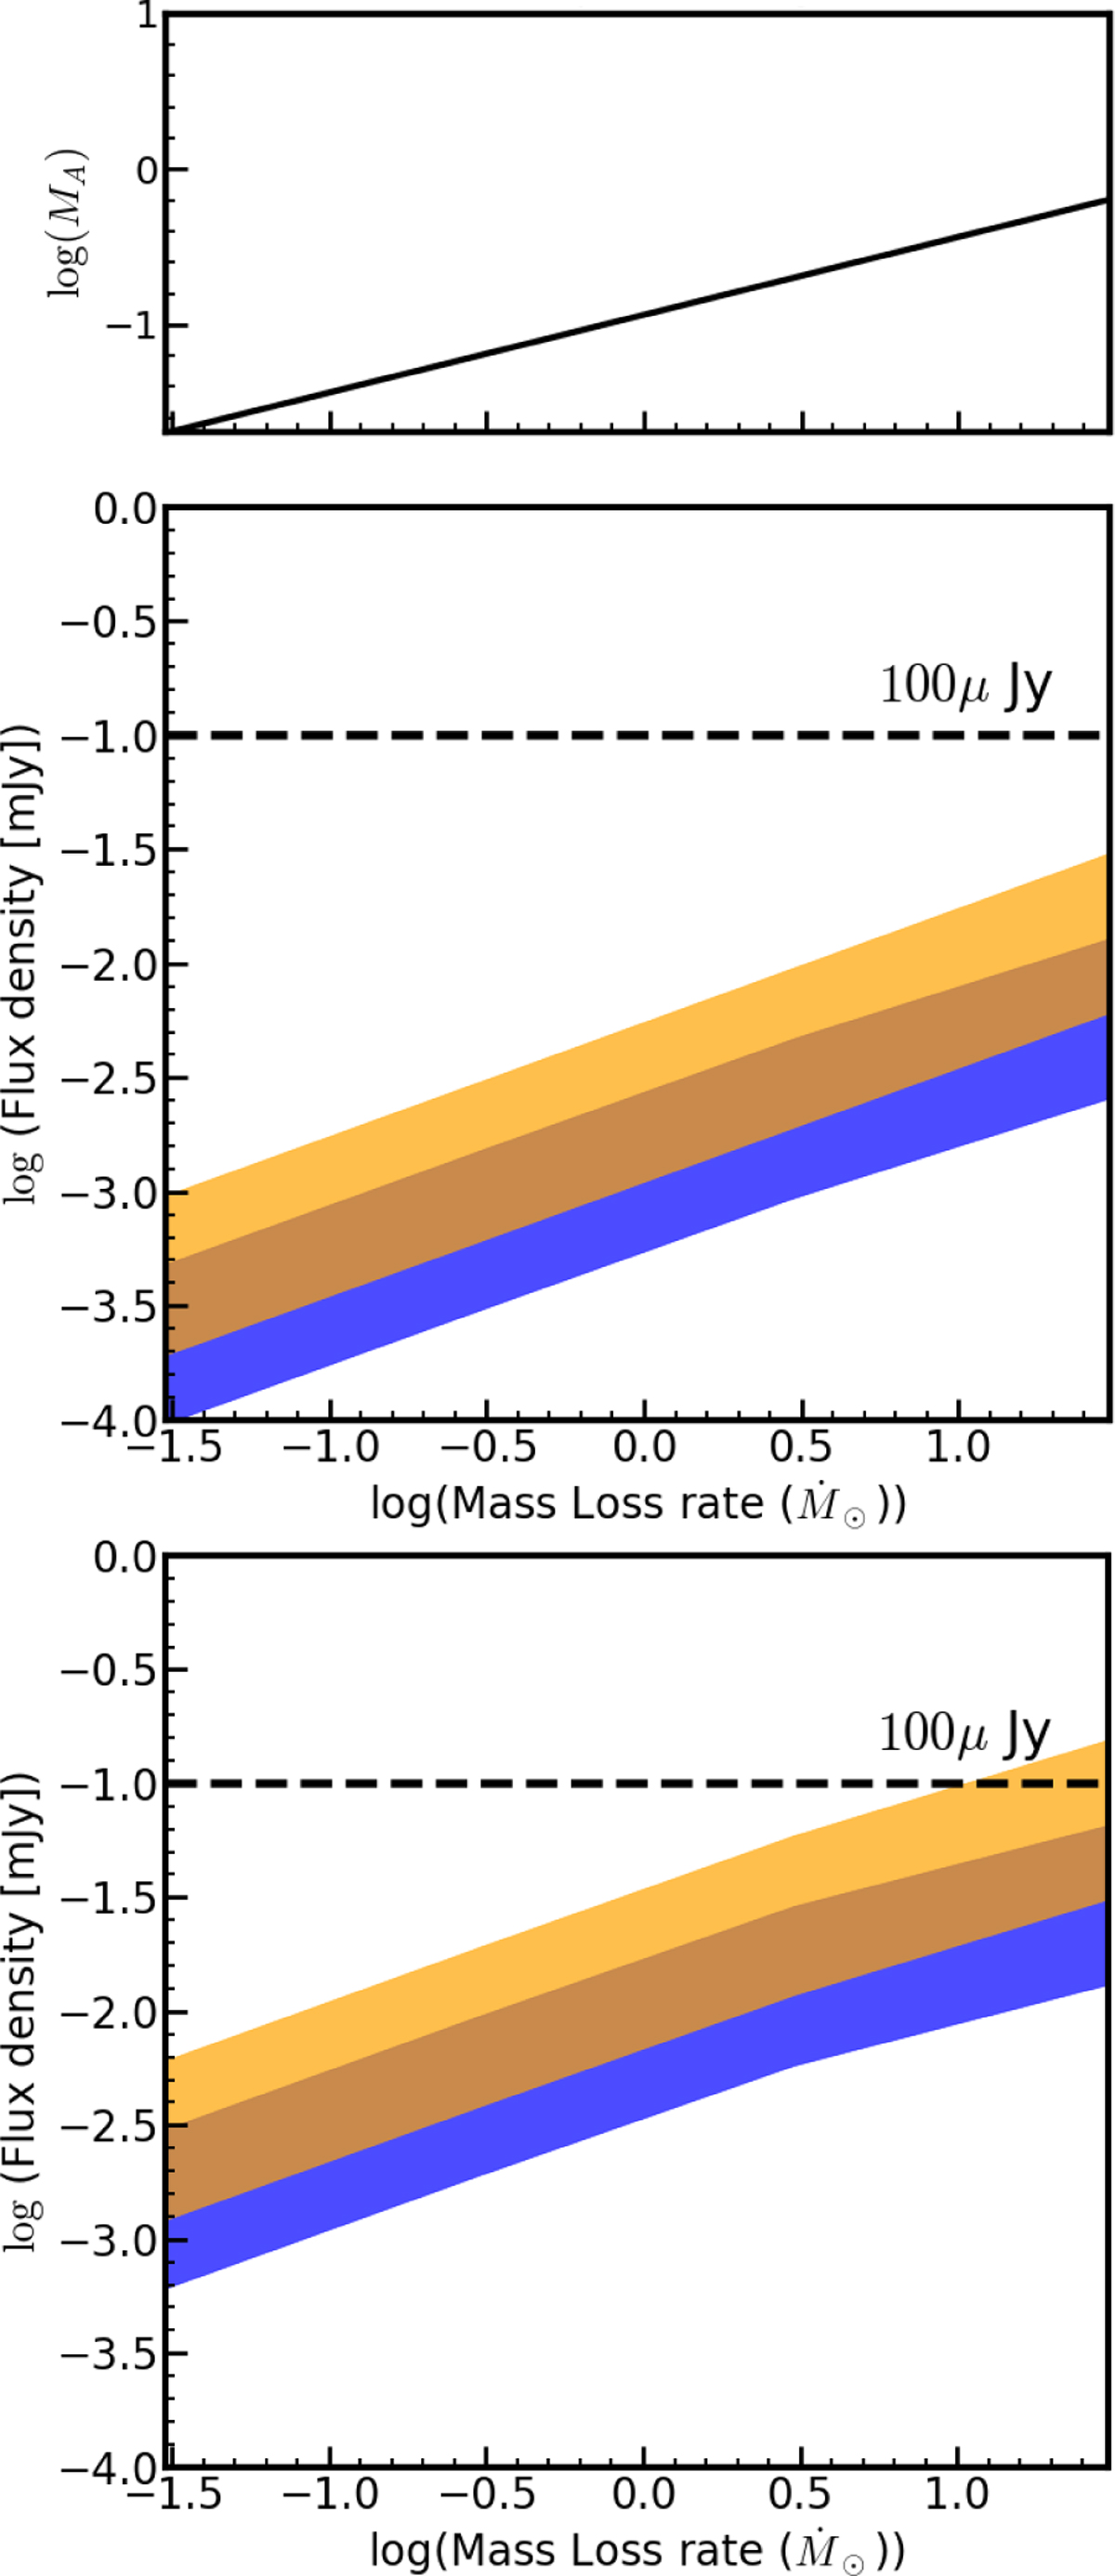
Alfvén Mach number (upper panel) and flux density (for Bpl = 0 and 1 G for middle and lower panels, respectively) arising from SPI as a function of the stellar mass-loss rate (in solar units). The emission expected from Saur-Turnpenney’s model is shown in orange, and the emission expected from the Zarka-Lanz model is shown in blue. The overlap of the models is shown in brown. The dashed black line represents the assumed detection threshold of 100 μJy.
Current usage metrics show cumulative count of Article Views (full-text article views including HTML views, PDF and ePub downloads, according to the available data) and Abstracts Views on Vision4Press platform.
Data correspond to usage on the plateform after 2015. The current usage metrics is available 48-96 hours after online publication and is updated daily on week days.
Initial download of the metrics may take a while.