Fig. 16
Download original image
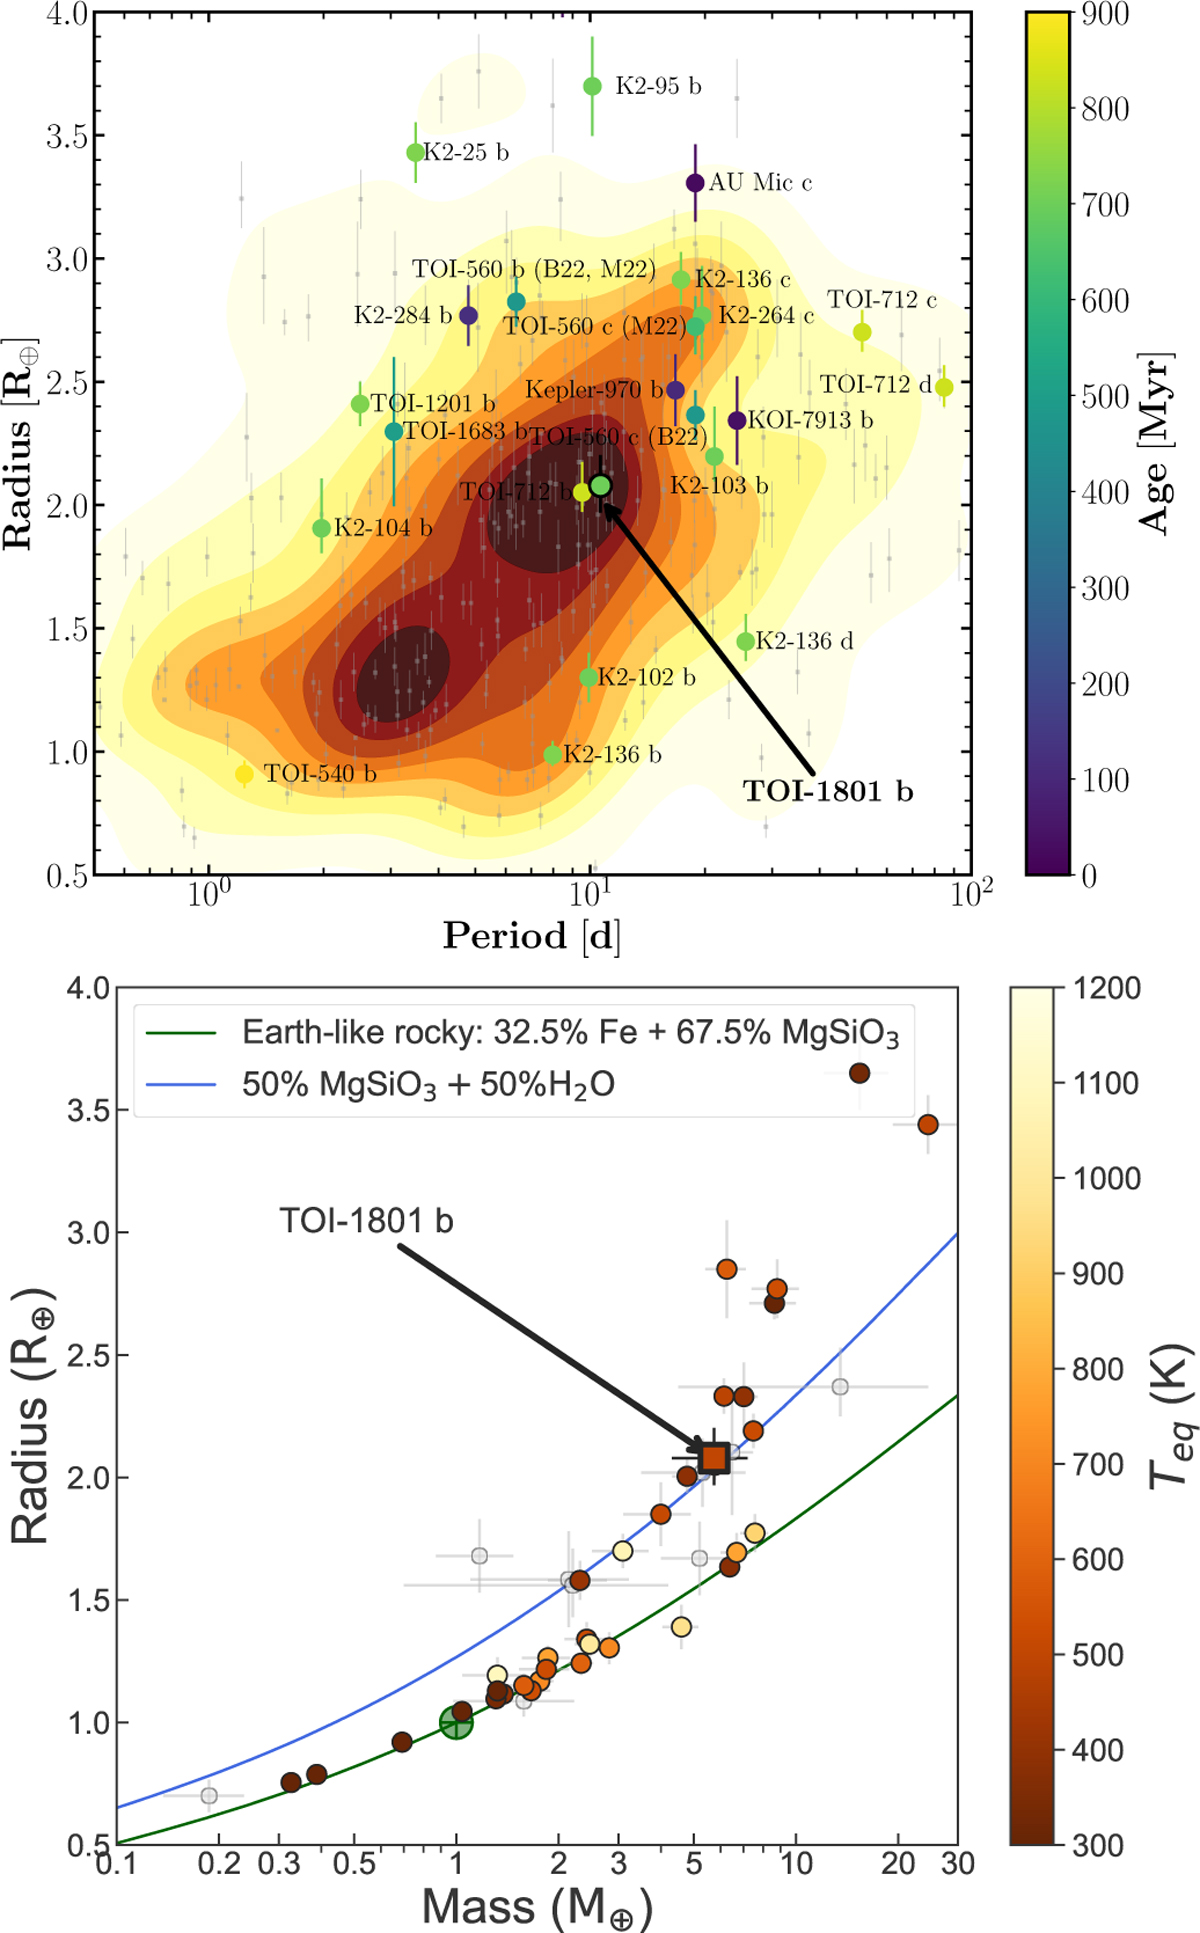
Mass-period-radius diagram. Top: period-radius diagram with all known transiting planets around low-mass stars (T*,eff < 4700 K, 0.5 R⊕ < Rp < 4 R⊕, 1 d < Porb < 100 d, following Cloutier & Menou 2020). The contour lines represent the 2D distribution of the planet radius as a function of orbital period around low-mass stars, where the grey dots indicate each independent value. We overplot the population of young (< 900 My) transiting planets with dots, and colour represents the planet age. The position of TOI-1801 b is also marked. Bottom: mass-radius diagram of all known small planets with precisely measured masses (Mp < 25%) and radii (Rp < 8%), around M-type stars (Teff < 4000 K) from Luque & Pallé (2022). Two theoretical composition models (Zeng et al. 2019) are plotted: an Earth-like composition (mass fractions of 32.5% iron and 67.5% silicates, green curve) and a planet consisting of 50% water-dominated ices and 50% silicates (blue curve). Planets are colour-coded by their equilibrium temperature. TOI-1801 b is marked with a square.
Current usage metrics show cumulative count of Article Views (full-text article views including HTML views, PDF and ePub downloads, according to the available data) and Abstracts Views on Vision4Press platform.
Data correspond to usage on the plateform after 2015. The current usage metrics is available 48-96 hours after online publication and is updated daily on week days.
Initial download of the metrics may take a while.