Fig. 15
Download original image
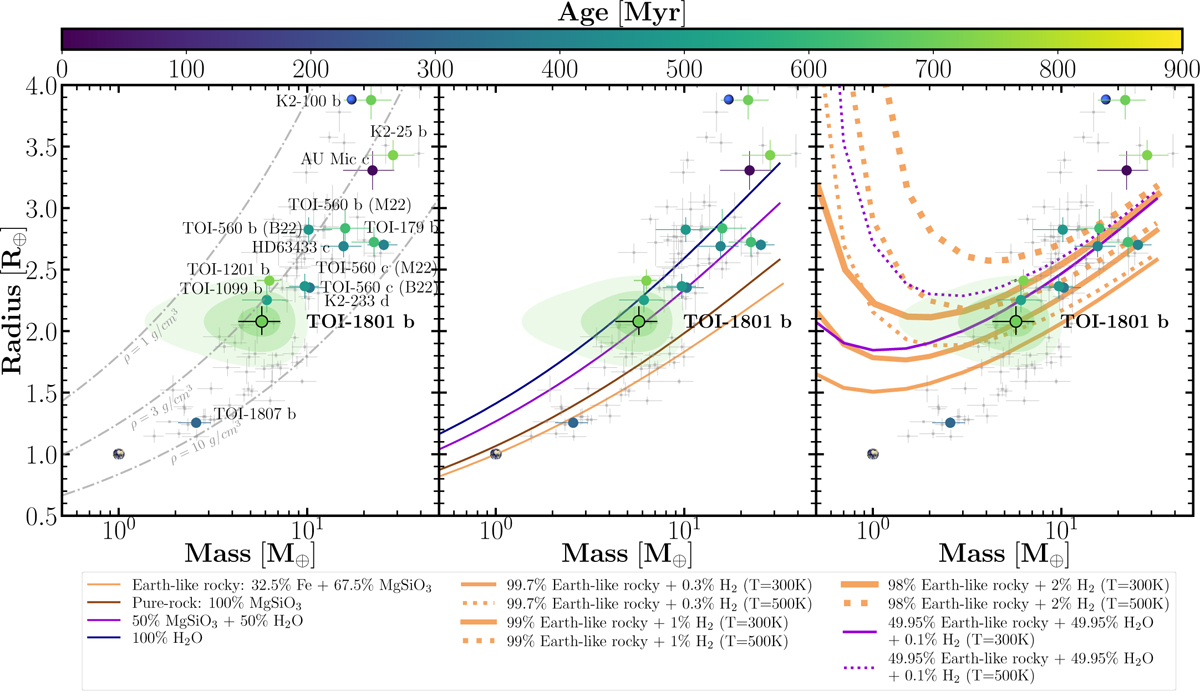
Mass-radius diagram for TOI-1801 b, together with all known exoplanets (grey dots) with a precision better than 8% in radius (through transit) and 20% in mass (from RV). The population of young transiting exoplanets (<900 Myr) with measured masses is plotted as coloured dots, according to their ages. The uncertainties on TOI-1801 b are shown as coloured shaded regions with 1, 2, and 3σ levels of confidence. In the left panel, the iso-density lines are displayed as dashed grey lines. In the remaining panels where the population of exoplanets is plotted along with TOI-1801 b, coloured lines indicate different composition models without gas (middle panel) and with a gas envelope (right panel) from Zeng et al. (2019). In the right panel, the solid and dotted lines show the models with temperatures of 300 and 500 K, respectively, of the corresponding specific entropy at 100 bar level in the gas envelope. The Earth and Neptune are also depicted as reference. We include B22 and M22 as references because different results have been published for the same planet, and this refers to Barragán et al. (2022) and El Mufti et al. (2023), respectively.
Current usage metrics show cumulative count of Article Views (full-text article views including HTML views, PDF and ePub downloads, according to the available data) and Abstracts Views on Vision4Press platform.
Data correspond to usage on the plateform after 2015. The current usage metrics is available 48-96 hours after online publication and is updated daily on week days.
Initial download of the metrics may take a while.